 |
| Coherente con el análisis del mercado norteamericano de acciones http://swelltrader.blogspot.com/2010/01/actual-pullback-del-mercado-de.html, el EURUSD podría estar a punto de retomar su tendencia alcista. Mis argumentos son los siguientes: A partir de ese punto deberíamos retomar la tendencia alcista. |
| - |


Mar de Leva (swell waves) en Cartagena de Indias - Colombia
Sunday, January 24, 2010
EURUSD ¿por cuanto tiempo bearish?

Tuesday, January 12, 2010
Anatomía de un Head and Shoulders en ciernes en USDJPY
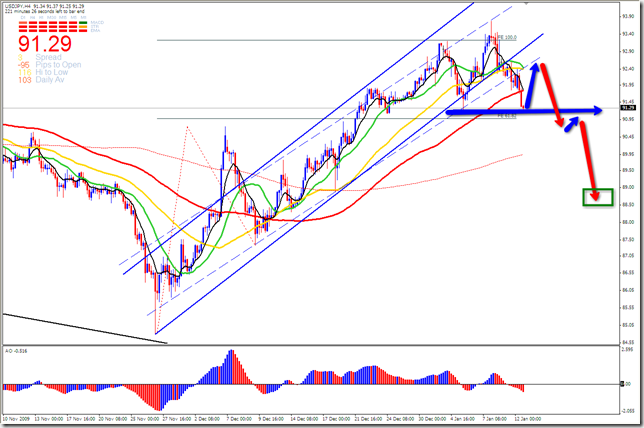 |
| El precio ha roto claramente el canal alcista en la franja de 4 horas. La confirmación de dicho rompimiento debería darse con un pullback hacia la línea de tendencia, tal como lo muestra la grafica. En dado caso, se estaría formando un patrón Head and Shoulders, que llevaría el precio hacia niveles de 88.47. El pullback (que conformaría el hombro derecho) no debería ser mayor que el Retroceso Fibonacci del 78.2% en 93.19. - |
Tuesday, September 29, 2009

Wednesday, September 2, 2009
Possible Bearish Gartley in EURUSD Daily TF
 |
| If price breaks bearish 1.4200 level, there will be big probabilities for this pattern to unfold. - |
Friday, August 21, 2009
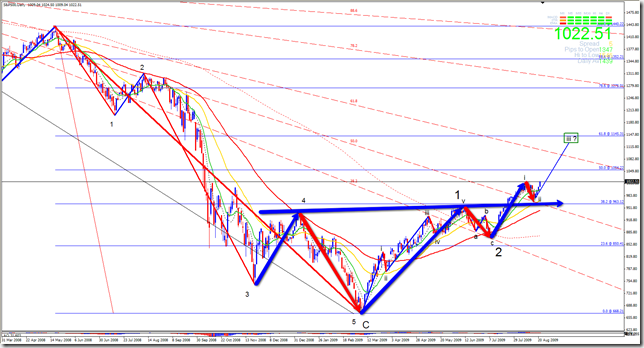
S&P Wave ii (bearish) finished
| As we can see, the new high after the AB=CD bearish correction confirms that wave ii is just finished. |
 |
| The wave ii mentioned above act as bigger bullish Head and Shoulder`s neckline retest. Since wave iii can not be the smaller wave of the 5 impulsive waves, we can expect this wave to have, at least, wave i`s measure. That give us a projection to, at least, 1.145.31 level, which corresponds with 61.8 fib retracement level of the entire move from October/2007 high to March/2009 low. I think that from now on, we can expect Huge moves, do to the fact that prices are now unfolding wave iii of a bigger wave 3. |
 |
| - |
Thursday, July 9, 2009
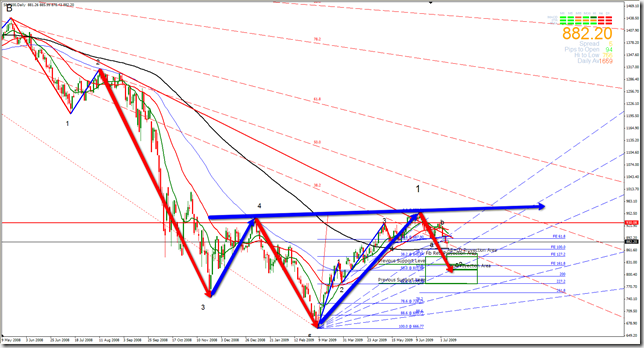
Stocks Market, major bottom in the making…



Friday, July 3, 2009
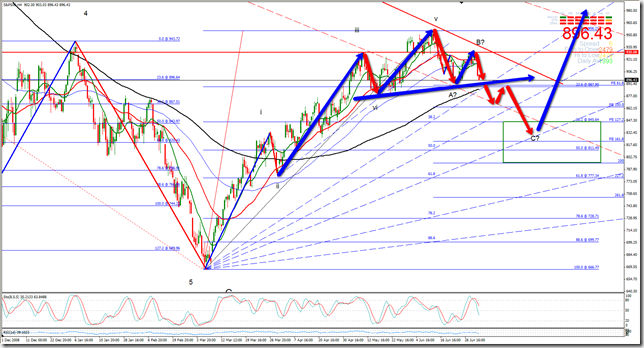
S&P bearish Head and Shoulders, coherent with Elliott Wave counting
| Continuing with my forecast done in June 15th ( see http://swelltrader.blogspot.com/2009/06/s-heading-for-bullish-head-and.html ), i see actual S&P index moves being coherent with the fact that the index is unfolding a bearish correction after 5 impulsive waves (i, ii, iii, iv & v), to conform wave 2 (ABC) of a bigger bullish move (5 bullish impulsive waves). Is very important to note that this bearish correction is being made thru the conformation of a possible bearish H&S in H4 time frame I`ll wait for H&S`s neckline break and retest for confirmation. |
 |
| - |
Monday, June 22, 2009

Monday, June 15, 2009
S&P… Heading for a Bullish Head and Shoulders?
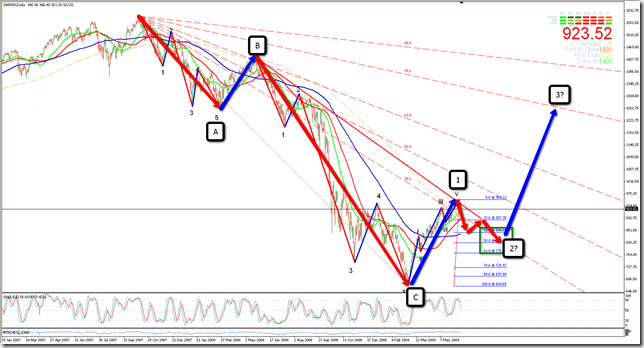
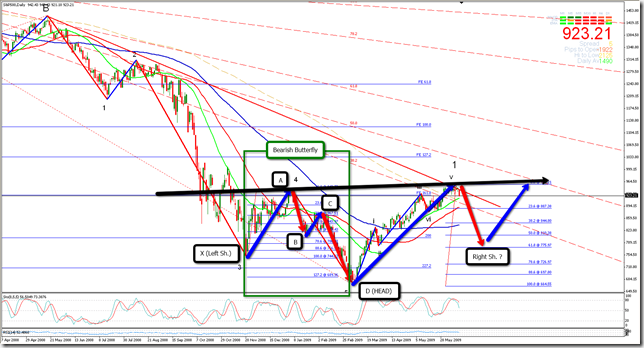
| Standard and Poor's 500 Index could be heading towards Right Shoulder of a Bullish Head and Shoulder (Inverted Head and Shoulder). Mainly two things are giving me signals for that: 1. Index moved down from 1.576 level @ 2007-10-10 to 663.29 level @ 2009-03-06 in a 3 corrective wave pattern (ABC). Since that low @ 663.29, price moved in a 5 impulsive wave pattern, and seems to be ended wave 5 @ 956.21 last 2009-06-11. |
| 2. Price broke 38.2 Fib Fan channel of the entire move form 1.576 level @ 2007-10-10 to 663.29 level @ 2009-03-06. I expect a correction down to 38.2 – 61.8 Fib Retracement level of this last swing (which will form Right Shoulder) before price resume rising to 61.8 Fib Fan level. |
 |
 |
Thursday, June 4, 2009
EURUSD Pullback, great opportunity before resuming bullish movements
EURUSD is pulling back after a Bearish Gartley unfolding.
El EURUSD esta retrocediendo después del desarrollo de un Gartley bajista.
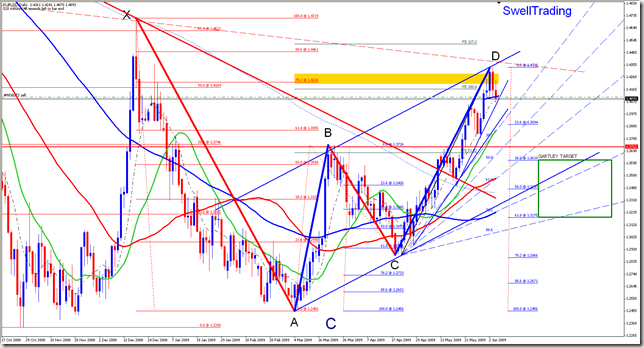
The entry for this 465 pips opportunity could be this H1 Bearish Head and Shoulders.
La entrada para esta oportunidad de 465 pips puede ser este Head and Shoulders en la franja H1

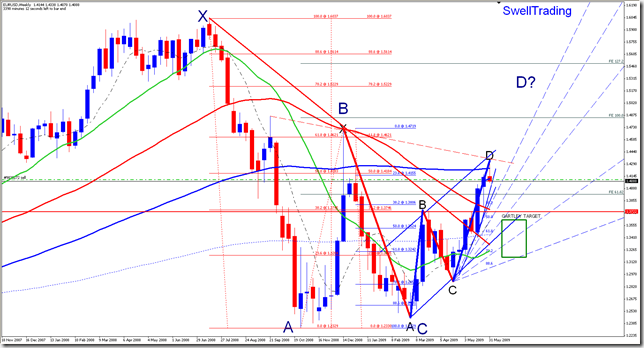
Is important to note that the EURUSD is within a bigger Bearish Gartley, now unfolding leg CD.
Meaning that EURUSD will resume its bullish movements after the pullback.
Es importante anotar que el EURUSD esta dentro de un Gartley bajista mayor, que ahora esta desarrollando la pierna CD.
Lo anterior quiere decir que se espera que después de este pullbak, el EURUSD retome sus movimientos alcistas.
-
Friday, May 15, 2009
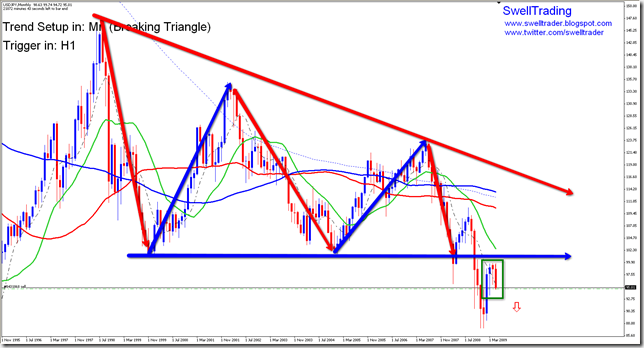
USDJPY H4/Daily Bearish Head & Shoulders

-
Friday, April 24, 2009
USDCOP, Follow up… sin comentarios…
 |
| Arriba, el forecast de principo de mes http://swelltrader.blogspot.com/search/label/USDCOP Abajo, la situación actual y proyección. |
 |
| - |
Tuesday, April 21, 2009
EURAUD, Follow up & Elliott Wave analysis
 |
| As i was expecting last week, price unfolded 5 bearish impulsive waves and broke the trend line bullish. |
| Tal y como lo estaba esperando la semana pasada, el precio ha desenvuelto 5 ondas impulsivas bajistas y rompió al alza. |
 |
| The break of the 1hour bearish trend line was unfolded thru 5 bullish impulsive waves and a ABC bearish corrective type wave, which is almost retesting the broken Trend line. |
| El rompimiento de la línea de tendencia en la franja de 1 hora, se desenvolvió a través de 5 ondas alcistas impulsivas y un patrón correctivo bajista del tipo ABC, que prácticamente esta haciendo un retest de la línea de tendencia rota previamente. |
 |
| The corrective move after the 5 bullish impulsive waves, is unfolding a Butterfly Harmonic Patter, which have 3 possibilities for point D as can be seen in the chart. |
| El movimiento correctivo posterior a las 5 ondas impulsivas alcistas, esta desenvolviendo un Patrón Armónico Butterfly, el cual tiene 3 posibilidades para su punto D, tal y como se puede ver en la gráfica. |
Monday, April 20, 2009
CITI, Follow up & Elliott Wave analysis
 |
| Elliott Wave analysis of the correction from 4.46, shows that this one could be reaching its ending level in a fib zone remarked in yellow. That means that we can be “ad portas” of wave 5 beginning |
| El análisis Elliott Wave de la corrección desde 4.46, muestra que esta podría estar llegando a su nivel de finalización en una zona fib remarcada en amarillo. Lo anterior significa que estaríamos “ad portas” del inicio de la onda cinco (5) - |
Wednesday, April 8, 2009
EURGBP, big bearish Butterfly & Gartley
 | As can be seen, there is a BIG Bearish Butterfly Harmonic Pattern in the monthly time frame, which give us the big picture of the price movement of the pair: Bearish. Than should lead prices down to, at least, 0.7741, which corresponds with 61.8 fib ret level of XA leg. Como se puede ver en la grafica, hay un gran patrón Armónico Butterfly bajista en la franja mensual, lo que nos da la visión general del movimiento del precio: bajista. Eso debe llevar el precio hasta, por lo menos, 0.774, que corresponde al 61.8 fib ret. del movimiento XA. |
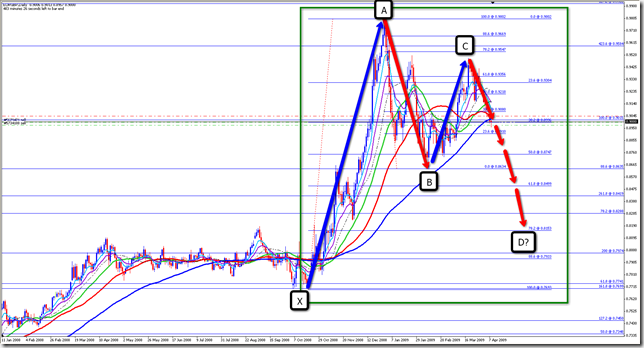 | Within that BIG Butterfly, price is unfolding what can be a bullish Gartley, now unfolding possible CD leg and which can be profited until its D point. Dentro de ese gran patrón Butterfly, el precio esta desenvolviendo un posible Gartley alcista, ahora desenvolviendo lo que sería el segmento CD y que puedeser transado hasta su punto D. |
Tuesday, April 7, 2009
S&P 500, Possible new bullish trend in the making
 | Bearish trend form 2007.10.07 @ 1575.58, could be reached its end. La tendencia bajista desde 2007.10.07 en el nivel de 1575.58, podría haber llegado su fin. Como se puede ver en la gráfica, el movimiento se desenvolvió en un patrón correctivo de 3 ondas, que encontró soporte en la zona fib compuesta por los niveles 227.2 y 423.6 correspondientes a la extension y expansión fib respectivamente. Hay que esperar nuevos máximos (ruptura del canal 38.2 Fib Fan, no mostrado), para poder confirmar la nueva tendencia. |
| - |
Friday, April 3, 2009
USDCAD, Gartley Harmonic Pattern in the making
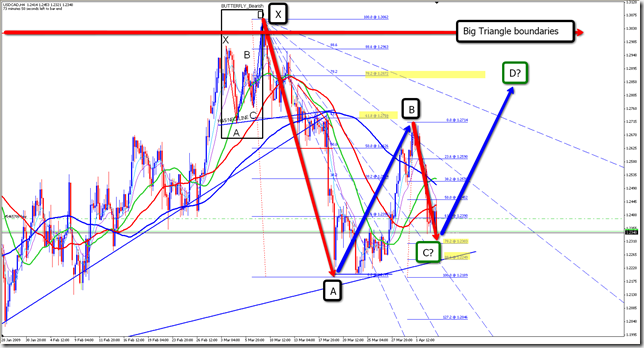 | Within the big ¿bullish? triangle , there is a possible Gartley in the making, now ending BC leg. Expecting to drop down to 1.2303 to conform C point and then begin rising to final D point. |
| - |
Thursday, April 2, 2009
USDCOP, Follow up
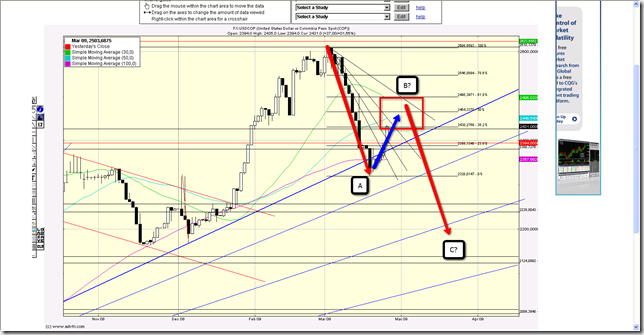 | El Jueves anterior, 26 de Marzo de 2009, escribíamos así acerca del USDCOP http://gustavoforex.blogspot.com/2009/03/usdcop-seguimiento-la-correccion.html |
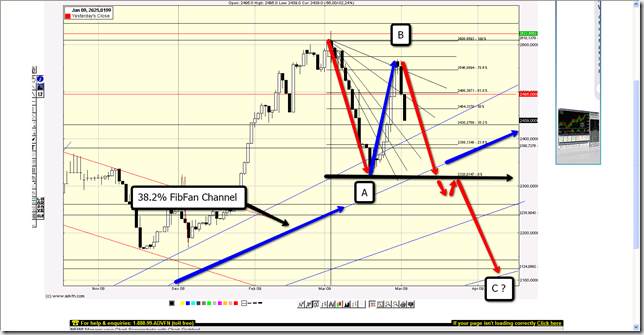 | Desde entonces se ha desarrollado el segmento AB y actualmente el precio esta desenvolviendo el segmento BC. La ruptura el mínimo anterior en 2320.01, implicaría que el precio estaría dentro del canal Fib Fan 38.2%. |
Performance


 Posts
Posts


