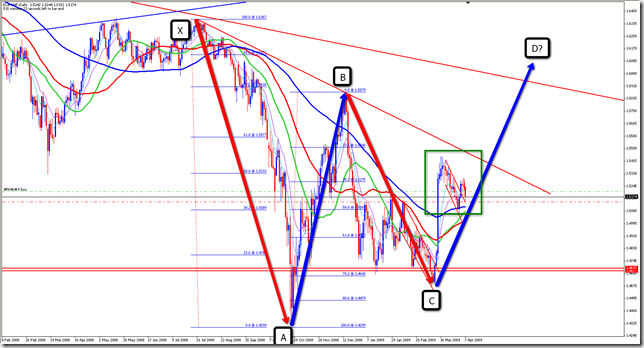
| This trend line break and retest and the apparently Head and Shoulders Pattern in the making, would be a text book correction ending. Este rompimiento y retest de tendencia y el aparente Patrón Head and Shoulders que se esta formando, seria un fin de corrección de “libro de texto”. |
 |
| - |


Mar de Leva (swell waves) en Cartagena de Indias - Colombia
Showing posts with label Correction. Show all posts
Showing posts with label Correction. Show all posts
Wednesday, September 30, 2009
EURUSD, end of correction?… if yes, a text book one

Monday, August 17, 2009
S&P Wave ii (bearish) in progress


Monday, July 13, 2009

Friday, July 3, 2009
S&P bearish Head and Shoulders, coherent with Elliott Wave counting
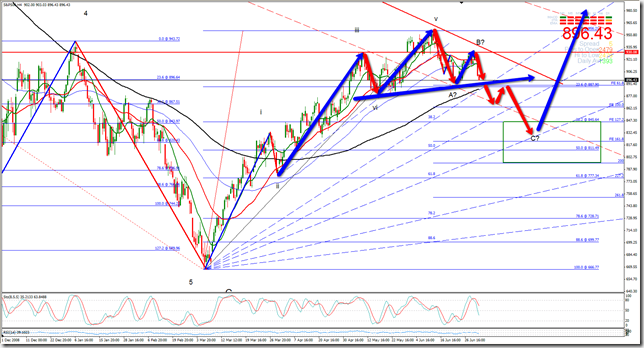
| Continuing with my forecast done in June 15th ( see http://swelltrader.blogspot.com/2009/06/s-heading-for-bullish-head-and.html ), i see actual S&P index moves being coherent with the fact that the index is unfolding a bearish correction after 5 impulsive waves (i, ii, iii, iv & v), to conform wave 2 (ABC) of a bigger bullish move (5 bullish impulsive waves). Is very important to note that this bearish correction is being made thru the conformation of a possible bearish H&S in H4 time frame I`ll wait for H&S`s neckline break and retest for confirmation. |
 |
| - |
Monday, June 15, 2009
S&P… Heading for a Bullish Head and Shoulders?
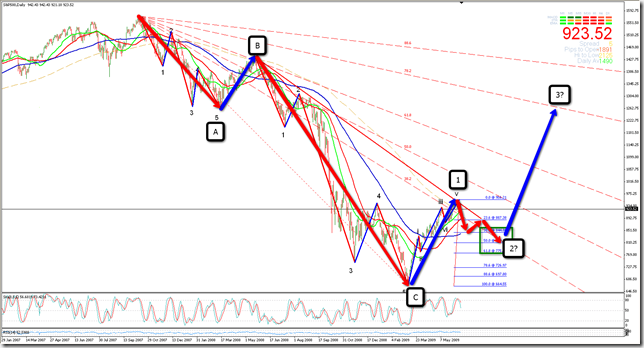
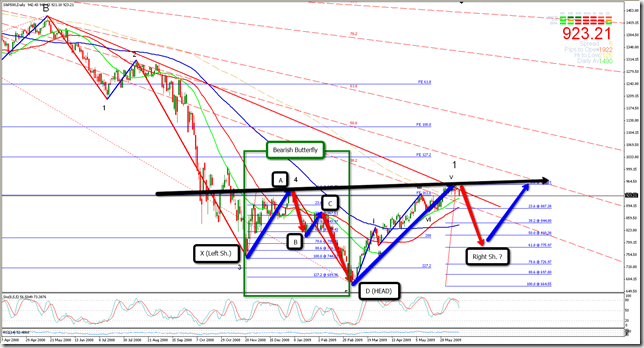
| Standard and Poor's 500 Index could be heading towards Right Shoulder of a Bullish Head and Shoulder (Inverted Head and Shoulder). Mainly two things are giving me signals for that: 1. Index moved down from 1.576 level @ 2007-10-10 to 663.29 level @ 2009-03-06 in a 3 corrective wave pattern (ABC). Since that low @ 663.29, price moved in a 5 impulsive wave pattern, and seems to be ended wave 5 @ 956.21 last 2009-06-11. |
| 2. Price broke 38.2 Fib Fan channel of the entire move form 1.576 level @ 2007-10-10 to 663.29 level @ 2009-03-06. I expect a correction down to 38.2 – 61.8 Fib Retracement level of this last swing (which will form Right Shoulder) before price resume rising to 61.8 Fib Fan level. |
 |
 |
Thursday, June 4, 2009
USDCOP, retroceso… justo y necesario
| Siendo coherentes con el retroceso anunciado en el EURUSD, lo que implica una fortaleza temporal en el US Dólar, es de esperarse que, confirmado ese escenario, el USDCOP experimente también un retroceso hacia el nivel de 2.165, donde el par debería rebotar para retomar su tendencia bajista y buscar el nivel proyectado de 1.953. |
 |
| - |
EURUSD Pullback, great opportunity before resuming bullish movements
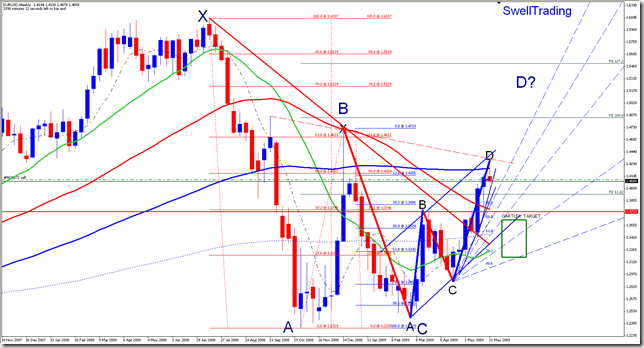
EURUSD is pulling back after a Bearish Gartley unfolding.
El EURUSD esta retrocediendo después del desarrollo de un Gartley bajista.
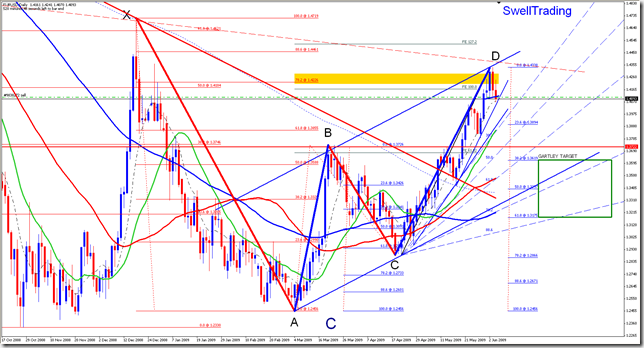
The entry for this 465 pips opportunity could be this H1 Bearish Head and Shoulders.
La entrada para esta oportunidad de 465 pips puede ser este Head and Shoulders en la franja H1

Is important to note that the EURUSD is within a bigger Bearish Gartley, now unfolding leg CD.
Meaning that EURUSD will resume its bullish movements after the pullback.
Es importante anotar que el EURUSD esta dentro de un Gartley bajista mayor, que ahora esta desarrollando la pierna CD.
Lo anterior quiere decir que se espera que después de este pullbak, el EURUSD retome sus movimientos alcistas.
-
Friday, April 24, 2009
USDCOP, Follow up… sin comentarios…
 |
| Arriba, el forecast de principo de mes http://swelltrader.blogspot.com/search/label/USDCOP Abajo, la situación actual y proyección. |
 |
| - |
Tuesday, April 21, 2009
EURAUD, Follow up & Elliott Wave analysis
 |
| As i was expecting last week, price unfolded 5 bearish impulsive waves and broke the trend line bullish. |
| Tal y como lo estaba esperando la semana pasada, el precio ha desenvuelto 5 ondas impulsivas bajistas y rompió al alza. |
 |
| The break of the 1hour bearish trend line was unfolded thru 5 bullish impulsive waves and a ABC bearish corrective type wave, which is almost retesting the broken Trend line. |
| El rompimiento de la línea de tendencia en la franja de 1 hora, se desenvolvió a través de 5 ondas alcistas impulsivas y un patrón correctivo bajista del tipo ABC, que prácticamente esta haciendo un retest de la línea de tendencia rota previamente. |
 |
| The corrective move after the 5 bullish impulsive waves, is unfolding a Butterfly Harmonic Patter, which have 3 possibilities for point D as can be seen in the chart. |
| El movimiento correctivo posterior a las 5 ondas impulsivas alcistas, esta desenvolviendo un Patrón Armónico Butterfly, el cual tiene 3 posibilidades para su punto D, tal y como se puede ver en la gráfica. |
Monday, April 20, 2009
CITI, Follow up & Elliott Wave analysis
 |
| Elliott Wave analysis of the correction from 4.46, shows that this one could be reaching its ending level in a fib zone remarked in yellow. That means that we can be “ad portas” of wave 5 beginning |
| El análisis Elliott Wave de la corrección desde 4.46, muestra que esta podría estar llegando a su nivel de finalización en una zona fib remarcada en amarillo. Lo anterior significa que estaríamos “ad portas” del inicio de la onda cinco (5) - |
Tuesday, April 7, 2009
USDJPY, Bearish Gartley
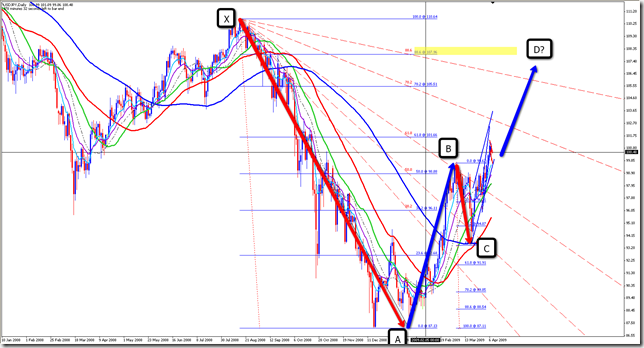 | As can be seen, price is moving within 61.8 and 78.2 fibfan channels, so is expected price to reach, at least, 78.2 channel. Como se puede ver en la gráfica, el precio se esta moviendo entre los canales fibfan 61.8 y 78.2, lo que implica que el precio debe llegar, por lo menos, al nivel del 78.2 fibfan channel. Además, el precio podría estar desarrollando un Patrón Armónico Gartley, lo que significa que este podría subir hasta el nivel del 88.6 fib ret. del segmento XA. |
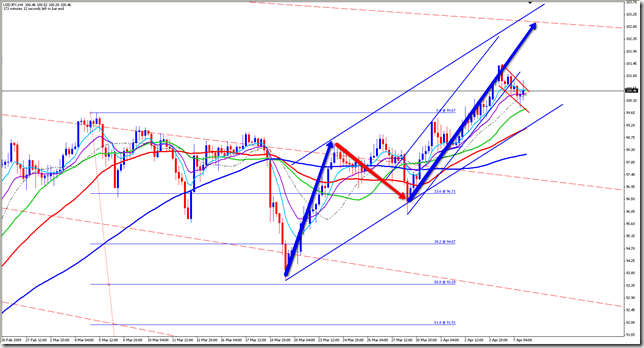 | In lower time frame, we can see price moving within a bullsih channel, no in a pullback. En franjas de tiempo menores, podemos ver que el precio se mueve dentro de un canal alcista y actualmente esta en un pullback. |
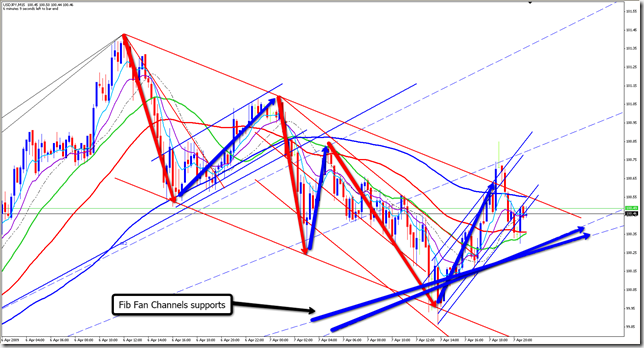 | In 15 min TF, we can see that price is moving between Fibfan channels supports and top side of the flag correction pattern. Have to wait for a breakout of the flag, or an entry to the fibfan channels which will make price to drop looking for the bottom side of the flag. En la franja de 15 minutos, podemos ver que el precio se esta moviendo entre los soportes que suministran los canales fibfan y la línea superior de la bandera correctiva bajista. Hay que esperar un breakout de dicha bandera O la entrada a los canales fibfan, lo que implicaría que el precio caería hasta la parte baja de la bandera bajista. |
-
EURUSD, follow up
 | The yellow line was the former trend line, based in which i made the previous forecast. http://swelltrader.blogspot.com/2009/04/eurusd-correction-finished.html There was a false breakout, as can be seen in the green rectangle. La línea amarilla fue la tendencia que fue usada para mi forecast anterior. http://swelltrader.blogspot.com/2009/04/eurusd-correction-finished.html Hubo una falsa ruptura, como puede ser visto en la grafica, remarcado en verde. Espero que el precio continúe cayendo hasta la parte baja de la bandera, marcado con el recuadro negro.
|
 | Previous forecast chart. |
| - |
S&P 500, Possible new bullish trend in the making
 | Bearish trend form 2007.10.07 @ 1575.58, could be reached its end. La tendencia bajista desde 2007.10.07 en el nivel de 1575.58, podría haber llegado su fin. Como se puede ver en la gráfica, el movimiento se desenvolvió en un patrón correctivo de 3 ondas, que encontró soporte en la zona fib compuesta por los niveles 227.2 y 423.6 correspondientes a la extension y expansión fib respectivamente. Hay que esperar nuevos máximos (ruptura del canal 38.2 Fib Fan, no mostrado), para poder confirmar la nueva tendencia. |
| - |
EURCHF, possible Gartley in the making
 | As show in the chart, we can be in segment CD of a Bearish Gartley Harmonic Pattern. Como se puede ver en la grafica, podriamos estar en el segmento CD de un Patron Armonico Gartley Bajista. Dicho segmento CD puede ser aprovechado si podemos montarnos en la transaccion justo despues de que la corrección actual haya terminado. |
 | The “tricky” situation is that price can be making a breakout of that bearish flag OR unfolding CD segment of a bearish AB=CD correction Pattern. La situación complicada es que el precio podría estar haciendo un rompimiento alcista de la bandera correctiva bajista, O desenvolviendo el segmento CD de un Patrón Correctivo Bajista AB=CD. |
| - |
Monday, April 6, 2009
EURUSD, Correction finished?
|
| Seems to be correction from 1.3737 previous high on 2009.03.19. has been broken. |
| - |

Subscribe to:
Posts (Atom)
Performance
Here i`ll post my performance on a USD 200 demo account.
After trading for 2 months, i`ll create a new one.


 Posts


