Mar de Leva (swell waves) en Cartagena de Indias - Colombia
Showing posts with label DOW. Show all posts

Thursday, July 23, 2009

Bullish Head and Shoulder almost confirmed, bottoming too…

On July 9th, i posted my forecast for DJI and S&P (view http://swelltrader.blogspot.com/2009/07/stocks-market-major-bottom-in-making.html ).
I was expecting price to unfold a short term Bearish H&S in both indexes, which should conform right shoulder of a bigger bullish H&S patter which, if confirmed, should mark bottoming of bearish move since actual economic crisis beginning.
The bearish H&S, was a fake. Price broke neckline and pulled back to retest but it didn't and continued bullish until actual prices.
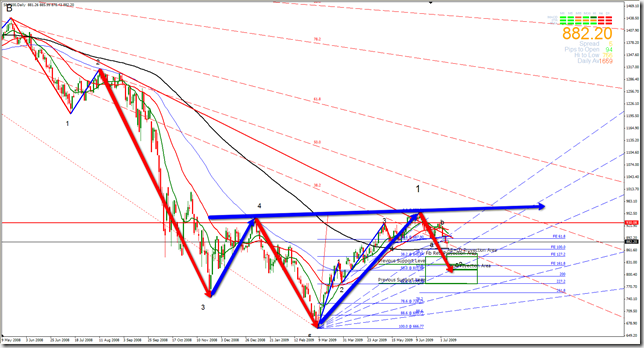
The bearish move was nothing more than an AB=CD pattern which finished @ 8.087.32  in DJI and @ 869.73 in S&P.

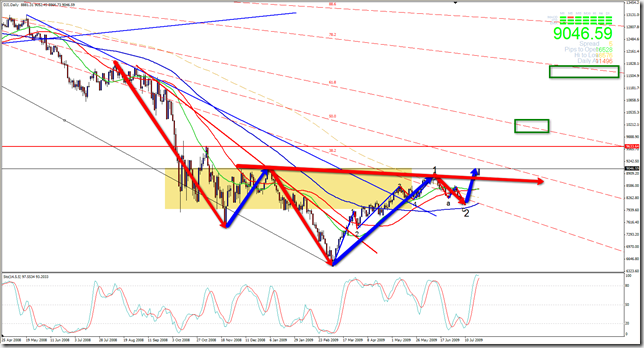
After the bearish move, prices begun to move bullish to actual levels, reaching and breaking bigger Bullish H&S`s Neckline.

I expect price pullback to retest broken neckline and continue rising to reach H&S and Fibonacci fibfans+Fibonacci Retracements projections (green rectangles)

Important to note that Elliott Wave counting shows that prices are now unfolding wave 3 of the entire move from the very low in March 06/2009.

2009-07-23_0942
2009-07-23_1006
-

Thursday, July 9, 2009

Stocks Market, major bottom in the making…

H4 time frame shows in both, Down Jones and S&P 500, a clear Head and Shoulders pattern actually retesting broken neckline.
Unfolding of these patterns plus detailed Fibonacci analysis and Elliott Wave counting, give me a very possible support area, that will conform Right shoulder of a Daily Bullish Head and Shoulders Pattern in both indexes that, if unfolded, meaning with that bullish neckline break, retest and new higher prices, it will give us the certainty of a daily trend change to the upside.

Having that said, what i FORECAST is:

S&P:
Drop down to an area within 853.40 to 777.44, then rise to 956.80 (Daily bullish H&S pattern`s Neckline level).

Dow Jones: Drop down to an area within 7.779 to 7.389, then rise to 8.873 (Daily bullish H&S pattern`s Neckline level).

S&P charts
2009-07-09_1038
 2009-07-09_1039
Dow Jones Charts
2009-07-09_1034
2009-07-09_1040
-

Thursday, April 2, 2009

Dow Jones Index, Important trend line break
2009-04-02_1016

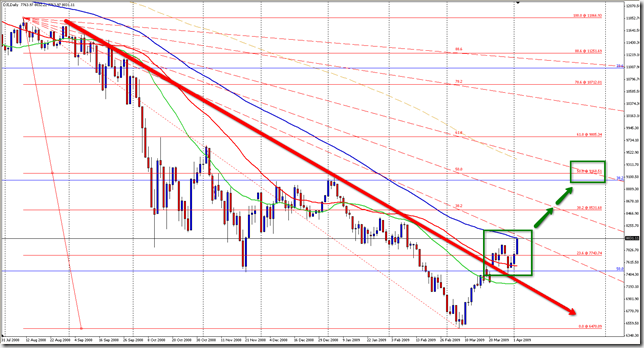
Still have to wait for a day close over previous high @ 7924.61, but bearish trend line break and retest (bigger green square) is a good signal for a new bullish trend establishment.
Price is about to enter 38.2% Fib Fan channel. If that occurs, price should climb up to, at least, 9168.51 fib zone level, marked within smaller green square.
Not showed, but AB=CD analysis from 6470.09 previous low also coincides with the mentioned fib zone level.
 

Teniendo que esperar todavía un cierre diario por encima del máximo anterior @ 7924.61, el breakout de la línea de tendencia bajista (marcado con el recuadro verde mas grande), es un buen síntoma para el establecimiento de una nueva tendencia alcista.

El precio esta a punto de entra en el canal Fib Fan del 38.2%. Si eso ocurre, deberá subir, por lo menos, al nivel de zona fib en 9168.51, marcado dentro del recuadro verde mas pequeño.

Aunque no lo muestro en la grafica, el análisis AB=CD desde el mínimo anterior en 6470.09, también coincide con el mencionado nivel de zona fib.

-  

Performance

Here i`ll post my performance on a USD 200 demo account. After trading for 2 months, i`ll create a new one.

Calendar