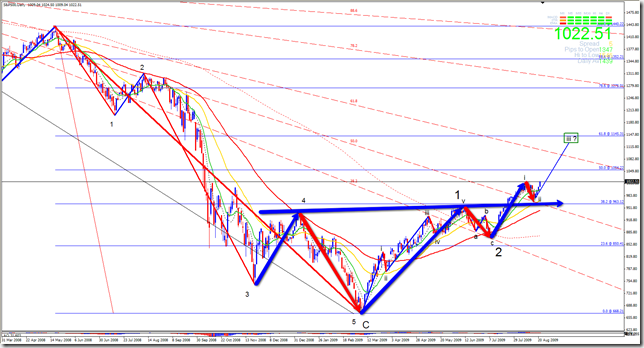
| As we can see, the new high after the AB=CD bearish correction confirms that wave ii is just finished. |
 |
| The wave ii mentioned above act as bigger bullish Head and Shoulder`s neckline retest. Since wave iii can not be the smaller wave of the 5 impulsive waves, we can expect this wave to have, at least, wave i`s measure. That give us a projection to, at least, 1.145.31 level, which corresponds with 61.8 fib retracement level of the entire move from October/2007 high to March/2009 low. I think that from now on, we can expect Huge moves, do to the fact that prices are now unfolding wave iii of a bigger wave 3. |
 |
| - |


Mar de Leva (swell waves) en Cartagena de Indias - Colombia
Showing posts with label NewTrend. Show all posts
Showing posts with label NewTrend. Show all posts
Friday, August 21, 2009
S&P Wave ii (bearish) finished

Friday, July 31, 2009
Stocks, bottom confirmed?
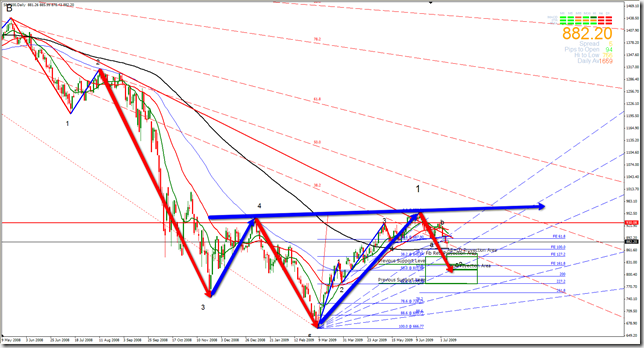
| With bullish Head and Shoulder`s neckline already broken, i`ll should wait for a decisive retest of this one; but due to GDP number better than expected released this morning, continuation without a pullback for retest could be possible. For detailed explanation of my forecast, see my videocast @ http://www.screencast.com/users/GustavoForex/folders/Swelltrader/media/8f6e9875-9ad1-422c-a6b1-332d0600e0cb |
 |
| - |
Thursday, July 9, 2009
Stocks Market, major bottom in the making…



Monday, June 15, 2009
S&P… Heading for a Bullish Head and Shoulders?
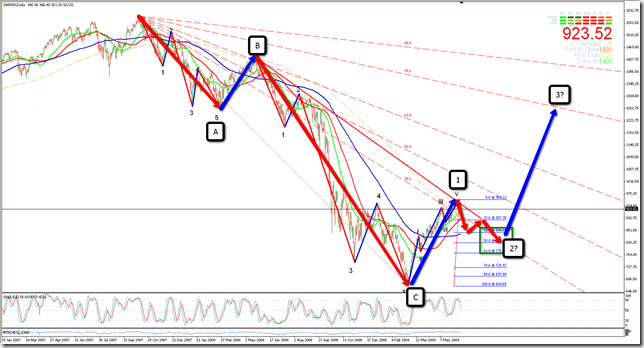
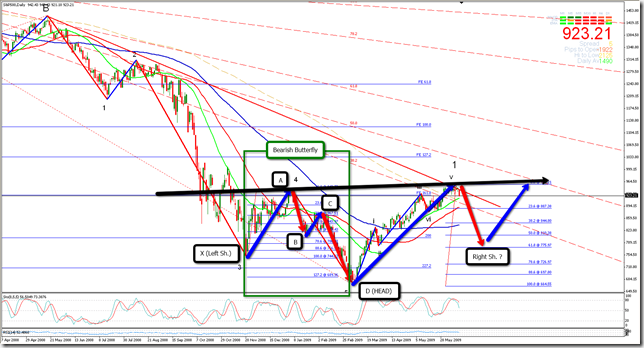
| Standard and Poor's 500 Index could be heading towards Right Shoulder of a Bullish Head and Shoulder (Inverted Head and Shoulder). Mainly two things are giving me signals for that: 1. Index moved down from 1.576 level @ 2007-10-10 to 663.29 level @ 2009-03-06 in a 3 corrective wave pattern (ABC). Since that low @ 663.29, price moved in a 5 impulsive wave pattern, and seems to be ended wave 5 @ 956.21 last 2009-06-11. |
| 2. Price broke 38.2 Fib Fan channel of the entire move form 1.576 level @ 2007-10-10 to 663.29 level @ 2009-03-06. I expect a correction down to 38.2 – 61.8 Fib Retracement level of this last swing (which will form Right Shoulder) before price resume rising to 61.8 Fib Fan level. |
 |
 |
Thursday, May 7, 2009
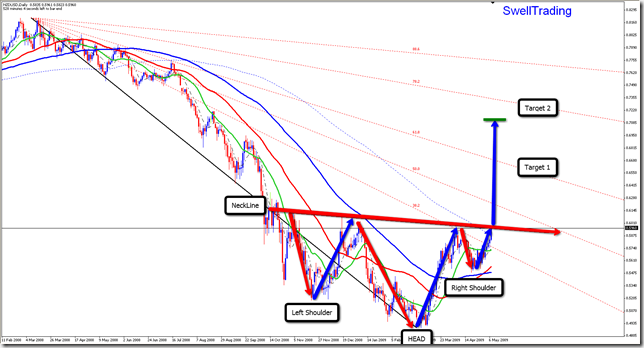
NZDUSD, H4 Bullish Head and Shoulders
This pair is now at a critical moment for trend reversal.
We`ll wait for break and retest of the neckline to go long. Note that price entered 38.2 fibfan channel. That should lead price to 61.8 level.
Este par esta pasando por un momento crítico para el cambio de tendencia.
Esperare un break and retest del neckline para comprar. Notar que el precio ha entrado en el canal Fibfan 38.2. Eso debe llevar el precio al nivel de 61.8.
-
Tuesday, April 7, 2009
S&P 500, Possible new bullish trend in the making
 | Bearish trend form 2007.10.07 @ 1575.58, could be reached its end. La tendencia bajista desde 2007.10.07 en el nivel de 1575.58, podría haber llegado su fin. Como se puede ver en la gráfica, el movimiento se desenvolvió en un patrón correctivo de 3 ondas, que encontró soporte en la zona fib compuesta por los niveles 227.2 y 423.6 correspondientes a la extension y expansión fib respectivamente. Hay que esperar nuevos máximos (ruptura del canal 38.2 Fib Fan, no mostrado), para poder confirmar la nueva tendencia. |
| - |
Thursday, April 2, 2009
Dow Jones Index, Important trend line break
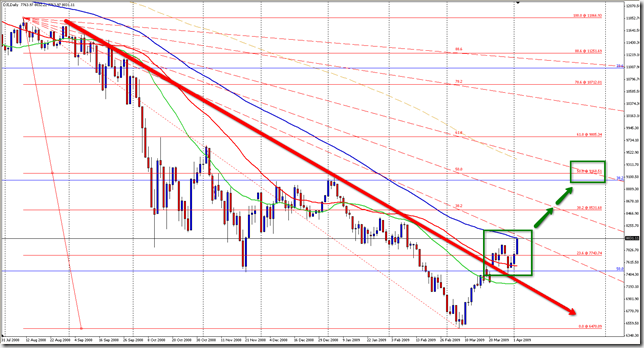 | Still have to wait for a day close over previous high @ 7924.61, but bearish trend line break and retest (bigger green square) is a good signal for a new bullish trend establishment. Teniendo que esperar todavía un cierre diario por encima del máximo anterior @ 7924.61, el breakout de la línea de tendencia bajista (marcado con el recuadro verde mas grande), es un buen síntoma para el establecimiento de una nueva tendencia alcista. El precio esta a punto de entra en el canal Fib Fan del 38.2%. Si eso ocurre, deberá subir, por lo menos, al nivel de zona fib en 9168.51, marcado dentro del recuadro verde mas pequeño. Aunque no lo muestro en la grafica, el análisis AB=CD desde el mínimo anterior en 6470.09, también coincide con el mencionado nivel de zona fib. |
| - |
Subscribe to:
Posts (Atom)
Performance
Here i`ll post my performance on a USD 200 demo account.
After trading for 2 months, i`ll create a new one.


 Posts
Posts


