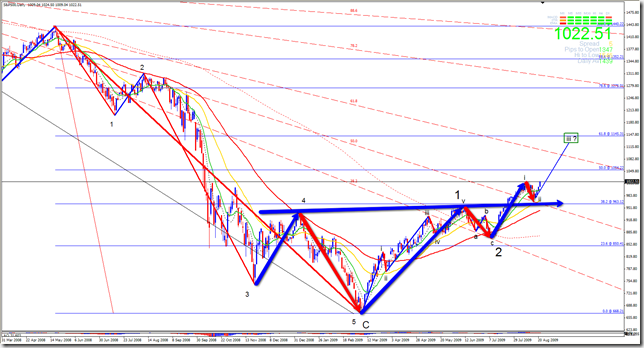
| As we can see, the new high after the AB=CD bearish correction confirms that wave ii is just finished. |
 |
| The wave ii mentioned above act as bigger bullish Head and Shoulder`s neckline retest. Since wave iii can not be the smaller wave of the 5 impulsive waves, we can expect this wave to have, at least, wave i`s measure. That give us a projection to, at least, 1.145.31 level, which corresponds with 61.8 fib retracement level of the entire move from October/2007 high to March/2009 low. I think that from now on, we can expect Huge moves, do to the fact that prices are now unfolding wave iii of a bigger wave 3. |
 |
| - |


Mar de Leva (swell waves) en Cartagena de Indias - Colombia
Showing posts with label Stocks. Show all posts
Showing posts with label Stocks. Show all posts
Friday, August 21, 2009
S&P Wave ii (bearish) finished

Friday, July 31, 2009
Stocks, bottom confirmed?
| With bullish Head and Shoulder`s neckline already broken, i`ll should wait for a decisive retest of this one; but due to GDP number better than expected released this morning, continuation without a pullback for retest could be possible. For detailed explanation of my forecast, see my videocast @ http://www.screencast.com/users/GustavoForex/folders/Swelltrader/media/8f6e9875-9ad1-422c-a6b1-332d0600e0cb |
 |
| - |
Friday, July 3, 2009
S&P bearish Head and Shoulders, coherent with Elliott Wave counting
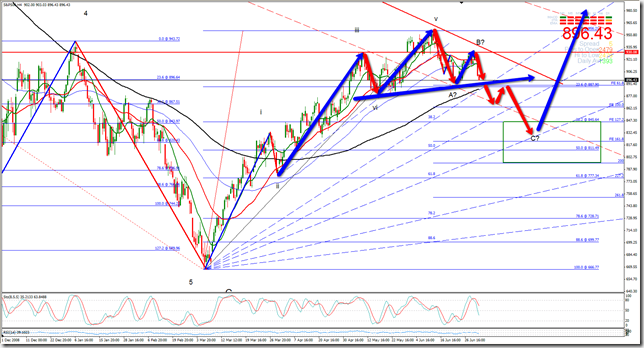
| Continuing with my forecast done in June 15th ( see http://swelltrader.blogspot.com/2009/06/s-heading-for-bullish-head-and.html ), i see actual S&P index moves being coherent with the fact that the index is unfolding a bearish correction after 5 impulsive waves (i, ii, iii, iv & v), to conform wave 2 (ABC) of a bigger bullish move (5 bullish impulsive waves). Is very important to note that this bearish correction is being made thru the conformation of a possible bearish H&S in H4 time frame I`ll wait for H&S`s neckline break and retest for confirmation. |
 |
| - |
Monday, April 20, 2009
CITI, Follow up & Elliott Wave analysis
 |
| Elliott Wave analysis of the correction from 4.46, shows that this one could be reaching its ending level in a fib zone remarked in yellow. That means that we can be “ad portas” of wave 5 beginning |
| El análisis Elliott Wave de la corrección desde 4.46, muestra que esta podría estar llegando a su nivel de finalización en una zona fib remarcada en amarillo. Lo anterior significa que estaríamos “ad portas” del inicio de la onda cinco (5) - |
Tuesday, April 14, 2009
Tell me that Fibs don´t work
 |
| As Sunil Mangwani, one of my teachers use to say “… tell me that fibs don´t work…” See how price bounced exactly form Fib fan channel and Fib extension zone. |
| Como diría Sunil Mangwani, uno de mis profesores: “…díganme que los Fibs no funcionan…” Miren como el precio reboto exactamente en la zona fib entre Fans y extensión. - |
CITI, Finally new highs…
 |
| Finally we have new highs in this stock. Price seems to be unfolding Wave 3 of a bigger Wave 3. If price breaks 61.8 Fib Fan Channel, we should expect price to go up to 6.00 level. Finalmente tenemos nuevos máximos en esta acción. Aparentemente el precio esta desenvolviendo una onda 3 de una onda 3 mas grande. Si el precio rompe el canal FibFan del 61.8, debemos esperar que suba hasta niveles de 6.00. |
| - |
Tuesday, April 7, 2009
S&P 500, Possible new bullish trend in the making
 | Bearish trend form 2007.10.07 @ 1575.58, could be reached its end. La tendencia bajista desde 2007.10.07 en el nivel de 1575.58, podría haber llegado su fin. Como se puede ver en la gráfica, el movimiento se desenvolvió en un patrón correctivo de 3 ondas, que encontró soporte en la zona fib compuesta por los niveles 227.2 y 423.6 correspondientes a la extension y expansión fib respectivamente. Hay que esperar nuevos máximos (ruptura del canal 38.2 Fib Fan, no mostrado), para poder confirmar la nueva tendencia. |
| - |
Wednesday, April 1, 2009
CITI, 5 min Bullish Pennant (Follow Up)
 | What was expected to be a Bullish Pennant, finally became a Bullish Flag (See red square). While i am writing this post, 1 hour after market open, seems to be buyers are taking control of the session since retest is having problems to occur. Lo que se esperaba fuera un banderín alcista, finalmente se convirtió en una bandera alcista (Ver recuadro rojo). En la apertura de hoy, el precio “exploto” como se preveía, con una exactitud “al pip” (30 pips). Mientras escribo este post, una hora después de abierto el mercado, parece ser que los compradores están tomando el control de la sesión, debido a la dificultad que se nota para que el retest ocurra. |
| - |
Subscribe to:
Posts (Atom)
Performance
Here i`ll post my performance on a USD 200 demo account.
After trading for 2 months, i`ll create a new one.


 Posts

