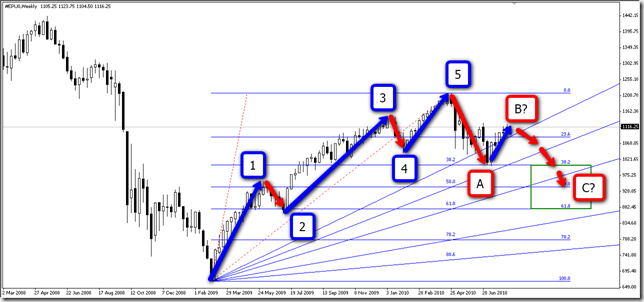
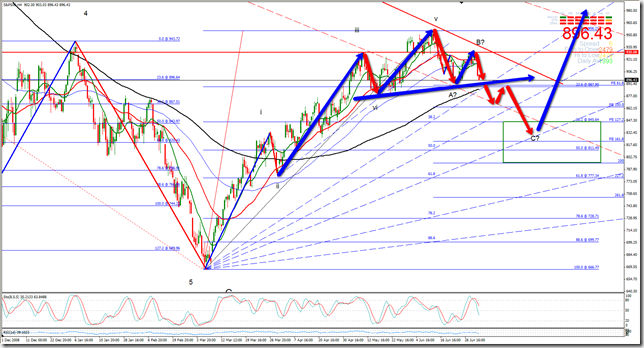
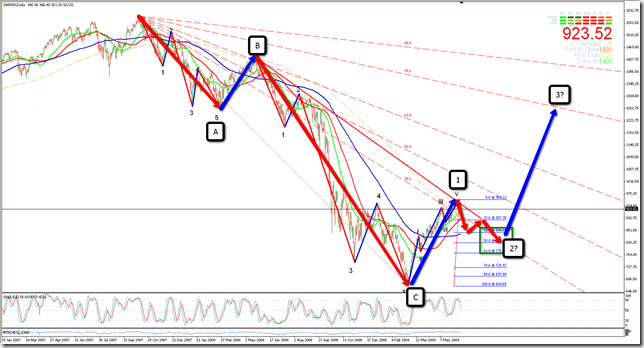
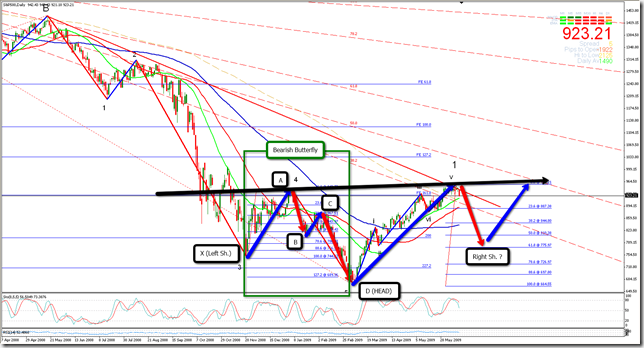
| After the clearly defined 5 waves bullish move, price is unfolding an ABC correction pattern, now at possible wave B completion as seen in Chart 2. Is important to note, as seen in Chart 1, that even though price rejected from 38.2 Fib Retracement level, it entered and broke 38.2 Fib Fan Channel, giving high possibilities of reaching 61.8 level. Finally, but not less important, is the possible Head and Shoulders pattern seen in Chart 3. Note the symmetry shown between the time spent by price to go from Left Shoulder date to Head and from Head to the possible Right Shoulder (71 days). |
| Chart 1. Elliott Wave counting. |
 |
| Chart 2. Wave B of possible ABC correction. |
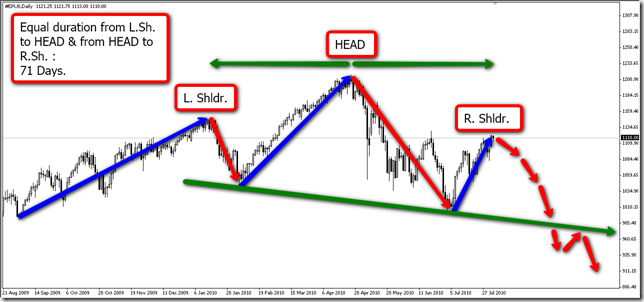 |
| Chart 3. Possible daily Bearish Head and Shoulders in the making. |


Mar de Leva (swell waves) en Cartagena de Indias - Colombia
Showing posts with label ClassicPattern. Show all posts
Showing posts with label ClassicPattern. Show all posts
Tuesday, August 3, 2010
I insist… S&P Bearish Head and Shoulders in the making

Tuesday, January 12, 2010
Anatomía de un Head and Shoulders en ciernes en USDJPY
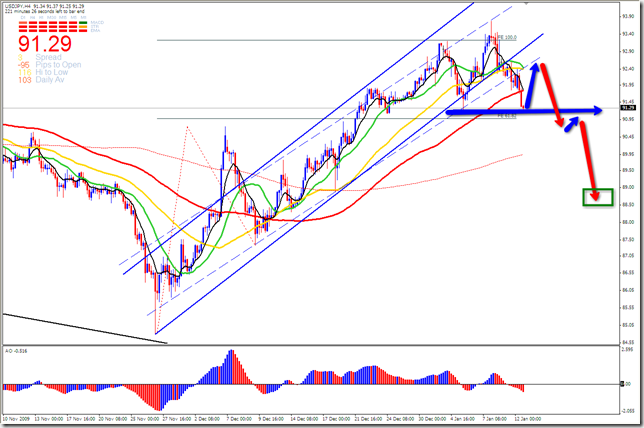 |
| El precio ha roto claramente el canal alcista en la franja de 4 horas. La confirmación de dicho rompimiento debería darse con un pullback hacia la línea de tendencia, tal como lo muestra la grafica. En dado caso, se estaría formando un patrón Head and Shoulders, que llevaría el precio hacia niveles de 88.47. El pullback (que conformaría el hombro derecho) no debería ser mayor que el Retroceso Fibonacci del 78.2% en 93.19. - |
Wednesday, September 30, 2009
EURUSD, end of correction?… if yes, a text book one
| This trend line break and retest and the apparently Head and Shoulders Pattern in the making, would be a text book correction ending. Este rompimiento y retest de tendencia y el aparente Patrón Head and Shoulders que se esta formando, seria un fin de corrección de “libro de texto”. |
 |
| - |
Friday, July 31, 2009
USDCAD H4 Bearish Head and Shoulders… follow up
| Nice unfolding of this Head and Shoulders Top. |
Spotted on July 13  |
Nice unfolding. Green rectangle shows Head and Shoulder Pattern.  |
The pattern located within the bearish trend  |
| - |

Thursday, July 23, 2009
Bullish Head and Shoulder almost confirmed, bottoming too…
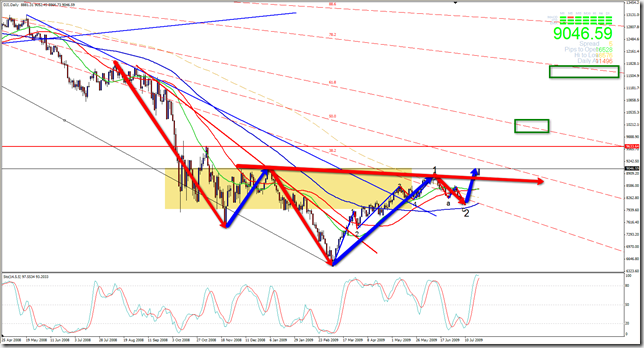
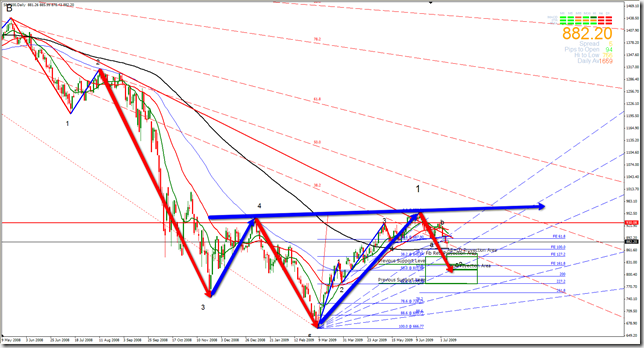
| On July 9th, i posted my forecast for DJI and S&P (view http://swelltrader.blogspot.com/2009/07/stocks-market-major-bottom-in-making.html ). |
| After the bearish move, prices begun to move bullish to actual levels, reaching and breaking bigger Bullish H&S`s Neckline. |
| I expect price pullback to retest broken neckline and continue rising to reach H&S and Fibonacci fibfans+Fibonacci Retracements projections (green rectangles) Important to note that Elliott Wave counting shows that prices are now unfolding wave 3 of the entire move from the very low in March 06/2009. |
 |
 |
| - |
Friday, July 17, 2009

Wednesday, July 15, 2009
USDJPY, very low risk Short Entry (H&S Pattern)
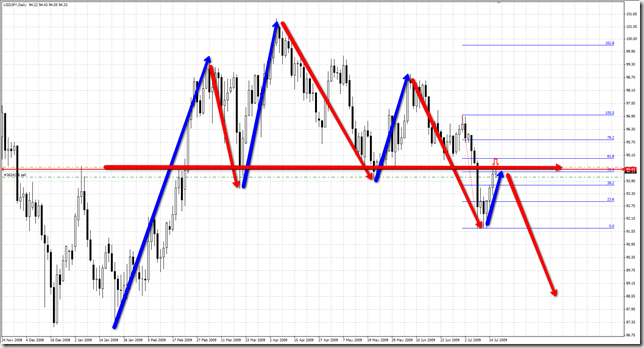 |
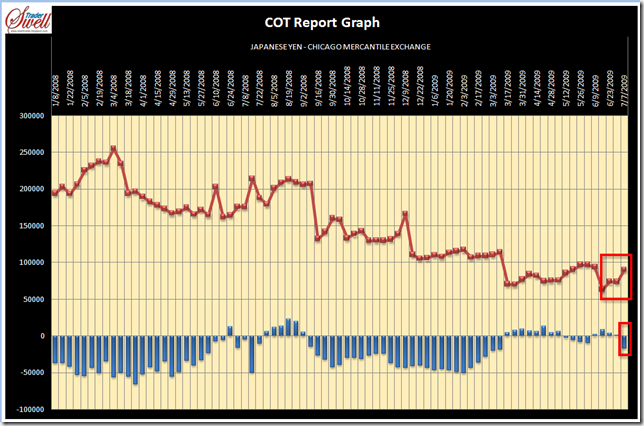
| Additionally to the bearish Head and Shoulders Pattern showed above, COT report (Commitment of Traders) analysis (below) for USDJPY, shows that the Non Commercials has been flipped to a Net Short position, after 16 weeks of indecision, which corresponds with the time expended for the H&S pattern to conform. I`ll maintain this trade until the COT report flips again but to a Net Long position and i will do it in a demo account, since is my first time in this kind of analysis. |
 |
| - |
Monday, July 13, 2009

Thursday, July 9, 2009
Stocks Market, major bottom in the making…



Tuesday, July 7, 2009
GBPJPY poised for a bearish move
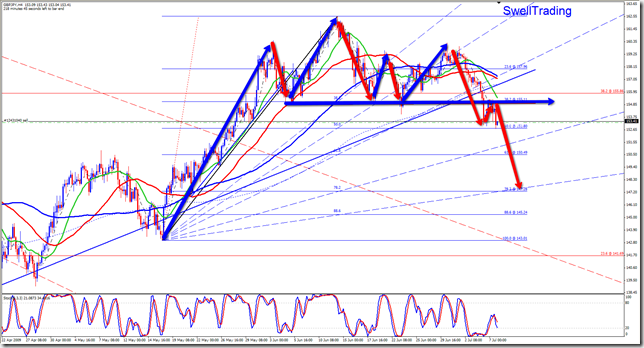
| Based on my previous post on june 22th ( http://swelltrader.blogspot.com/2009/06/gbpjpy-h4-head-and-shoulders-in-making.html ), and after the possible bearish H&S`s neckline has been broken and retested, i think this pair will unfold a big bearish move of about 700 pips. |
 |
| - |
Friday, July 3, 2009
S&P bearish Head and Shoulders, coherent with Elliott Wave counting
| Continuing with my forecast done in June 15th ( see http://swelltrader.blogspot.com/2009/06/s-heading-for-bullish-head-and.html ), i see actual S&P index moves being coherent with the fact that the index is unfolding a bearish correction after 5 impulsive waves (i, ii, iii, iv & v), to conform wave 2 (ABC) of a bigger bullish move (5 bullish impulsive waves). Is very important to note that this bearish correction is being made thru the conformation of a possible bearish H&S in H4 time frame I`ll wait for H&S`s neckline break and retest for confirmation. |
 |
| - |
Monday, June 22, 2009

Monday, June 15, 2009
S&P… Heading for a Bullish Head and Shoulders?
| Standard and Poor's 500 Index could be heading towards Right Shoulder of a Bullish Head and Shoulder (Inverted Head and Shoulder). Mainly two things are giving me signals for that: 1. Index moved down from 1.576 level @ 2007-10-10 to 663.29 level @ 2009-03-06 in a 3 corrective wave pattern (ABC). Since that low @ 663.29, price moved in a 5 impulsive wave pattern, and seems to be ended wave 5 @ 956.21 last 2009-06-11. |
| 2. Price broke 38.2 Fib Fan channel of the entire move form 1.576 level @ 2007-10-10 to 663.29 level @ 2009-03-06. I expect a correction down to 38.2 – 61.8 Fib Retracement level of this last swing (which will form Right Shoulder) before price resume rising to 61.8 Fib Fan level. |
 |
 |
EURUSD H4 Head and Shoulders… all ready!!
| AS forecasted on June 09 ( http://swelltrader.blogspot.com/2009/06/eurusd-follow-up-new-entry-opportunity.html ), Head and shoulders is unfolding well. All ready for Breakdown!! |
| De acuerdo a lo proyectado en Junio 09 ( http://swelltrader.blogspot.com/2009/06/eurusd-follow-up-new-entry-opportunity.html ), el Head and Shoulders en este par se esta desenvoplviendo bien. Todo listo para el Breakdown!! |
 |
| - |
Continuation Head and Shoulders Pattern… yes, it exists
| As a very interesting fact, i want to show this M5 “Continuation Head and Shoulders” pattern. |
| Como algo intersante, quiero mostrar este Head and Shoulders actuando como patron de continuidad. |
 |
| - |
Tuesday, June 9, 2009
EURUSD, Follow up, new entry opportunity
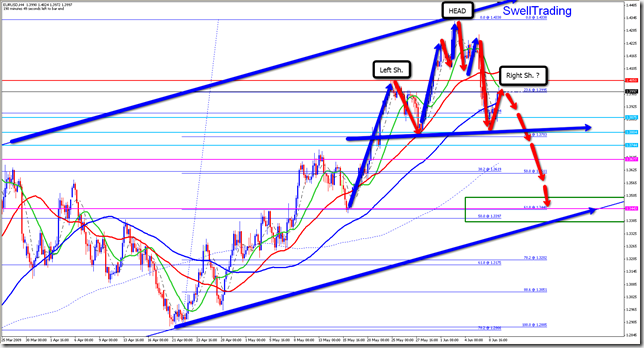
| Within the bearish scenario forecasted previously http://swelltrader.blogspot.com/2009/06/eurusd-pullback-great-opportunity.html , this is another opportunity for a nice profit of this pullback. |
 |
Monday, June 8, 2009
CITI, showing bullish signs…
| There are two important signs of bullish bias in this stock. The first one is the possible Head and Shoulder Pattern that is finding important resistance at Neckline. |
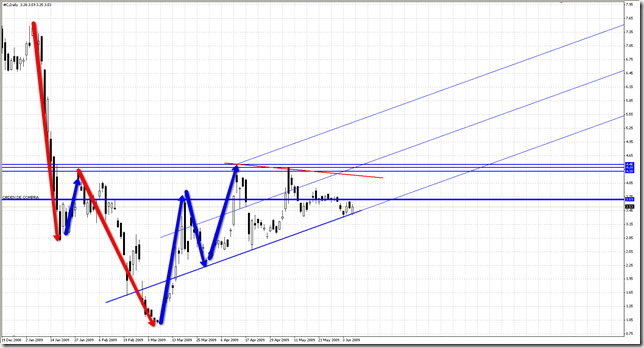 |
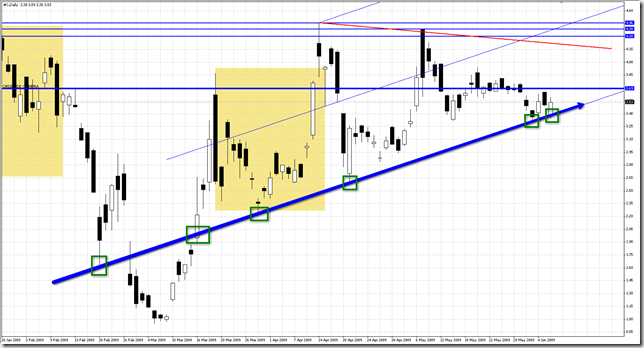
| In that context, a very important support Trend Line have been touched and respected for 6 times. |
 |
Thursday, June 4, 2009
EURUSD Pullback, great opportunity before resuming bullish movements
EURUSD is pulling back after a Bearish Gartley unfolding.
El EURUSD esta retrocediendo después del desarrollo de un Gartley bajista.
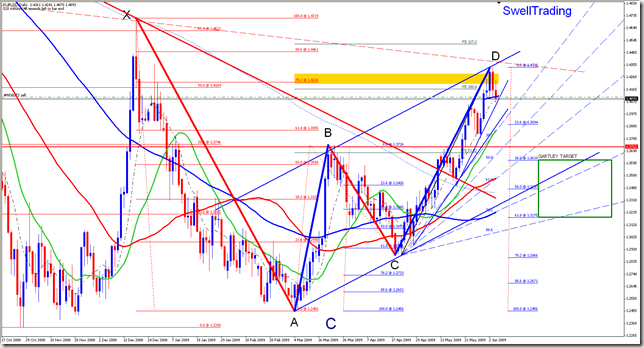
The entry for this 465 pips opportunity could be this H1 Bearish Head and Shoulders.
La entrada para esta oportunidad de 465 pips puede ser este Head and Shoulders en la franja H1

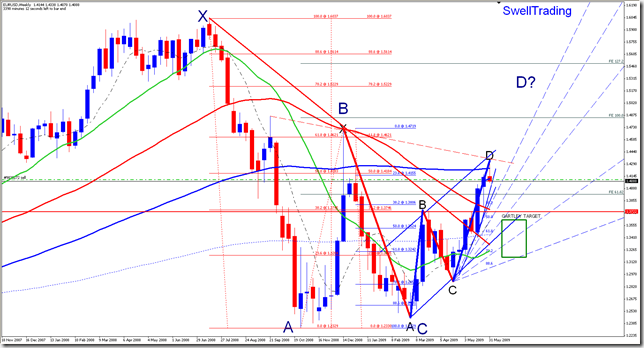
Is important to note that the EURUSD is within a bigger Bearish Gartley, now unfolding leg CD.
Meaning that EURUSD will resume its bullish movements after the pullback.
Es importante anotar que el EURUSD esta dentro de un Gartley bajista mayor, que ahora esta desarrollando la pierna CD.
Lo anterior quiere decir que se espera que después de este pullbak, el EURUSD retome sus movimientos alcistas.
-
Monday, June 1, 2009
NZDUSD… doing VERY well
This was the forecast i made at May 7th.: http://swelltrader.blogspot.com/2009/05/nzdusd-h4-bullish-head-and-shoulders.html
Este fue el forecast que hice en Mayo 7: http://swelltrader.blogspot.com/2009/05/nzdusd-h4-bullish-head-and-shoulders.html

Todate, the pair is unfolding a “textbook” Head and Shoulders … doing very well.
A la fecha, el parte esta desarrollando un Head and Shoulders “de libro”… va muy bien.

-
Subscribe to:
Posts (Atom)
Performance
Here i`ll post my performance on a USD 200 demo account.
After trading for 2 months, i`ll create a new one.


 Posts
Posts


