| El posible Patrón head and Shoulders identificado en Octubre 9 (Ver http://swelltrader.blogspot.com/2009/10/s-h1-bullish-continuation-head.html ), no se desarrollo. Sin embargo, a pesar de que el precio logro penetrar sutilmente los terrenos de la onda ii, considero que la onda iv ha quedado confirmada. |
 |
| - |


Mar de Leva (swell waves) en Cartagena de Indias - Colombia
Showing posts with label Bullish. Show all posts
Showing posts with label Bullish. Show all posts
Wednesday, October 14, 2009
S&P: Onda iv confirmada

Friday, October 9, 2009

Wednesday, September 30, 2009
EURUSD, end of correction?… if yes, a text book one
| This trend line break and retest and the apparently Head and Shoulders Pattern in the making, would be a text book correction ending. Este rompimiento y retest de tendencia y el aparente Patrón Head and Shoulders que se esta formando, seria un fin de corrección de “libro de texto”. |
 |
| - |
Wednesday, September 9, 2009
GBPUSD H1, Bullish Head and Shoulders
| Have to wait for confirmation of the 123 buy pattern, but i think the most of the possibilities are for a nice bullish move after the unfolding of this pattern. Hay que esperar la confirmación del patrón 123 de compra, pero creo que las mayores posibilidades son de un buen movimiento alcista después del desarrollo de este patrón. |
 |
| - |
Friday, August 21, 2009
S&P Wave ii (bearish) finished
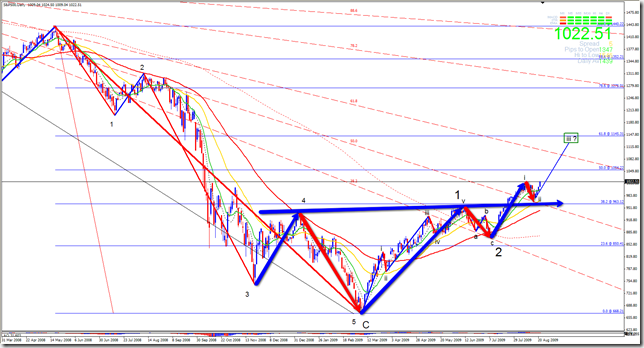
| As we can see, the new high after the AB=CD bearish correction confirms that wave ii is just finished. |
 |
| The wave ii mentioned above act as bigger bullish Head and Shoulder`s neckline retest. Since wave iii can not be the smaller wave of the 5 impulsive waves, we can expect this wave to have, at least, wave i`s measure. That give us a projection to, at least, 1.145.31 level, which corresponds with 61.8 fib retracement level of the entire move from October/2007 high to March/2009 low. I think that from now on, we can expect Huge moves, do to the fact that prices are now unfolding wave iii of a bigger wave 3. |
 |
| - |
Monday, August 17, 2009
S&P Wave ii (bearish) in progress


Friday, July 31, 2009
Stocks, bottom confirmed?
| With bullish Head and Shoulder`s neckline already broken, i`ll should wait for a decisive retest of this one; but due to GDP number better than expected released this morning, continuation without a pullback for retest could be possible. For detailed explanation of my forecast, see my videocast @ http://www.screencast.com/users/GustavoForex/folders/Swelltrader/media/8f6e9875-9ad1-422c-a6b1-332d0600e0cb |
 |
| - |
Monday, July 13, 2009

Friday, July 3, 2009
S&P bearish Head and Shoulders, coherent with Elliott Wave counting
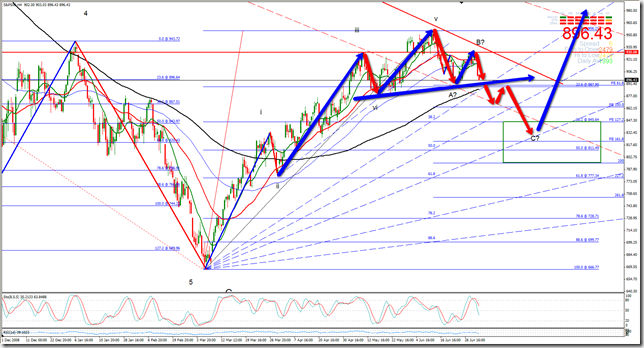
| Continuing with my forecast done in June 15th ( see http://swelltrader.blogspot.com/2009/06/s-heading-for-bullish-head-and.html ), i see actual S&P index moves being coherent with the fact that the index is unfolding a bearish correction after 5 impulsive waves (i, ii, iii, iv & v), to conform wave 2 (ABC) of a bigger bullish move (5 bullish impulsive waves). Is very important to note that this bearish correction is being made thru the conformation of a possible bearish H&S in H4 time frame I`ll wait for H&S`s neckline break and retest for confirmation. |
 |
| - |
Monday, June 15, 2009
S&P… Heading for a Bullish Head and Shoulders?
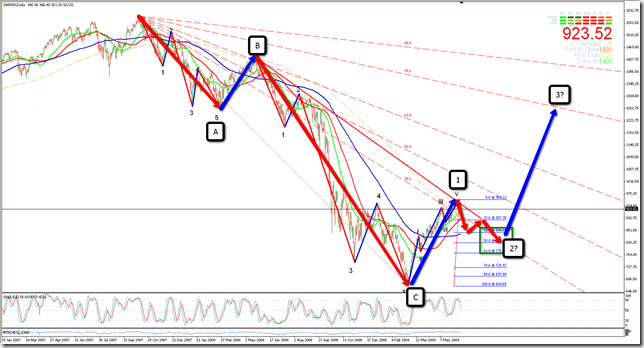
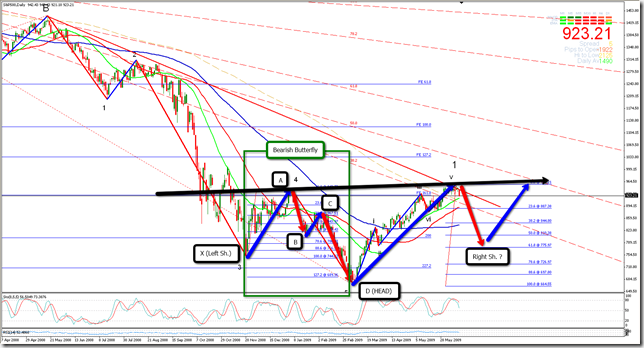
| Standard and Poor's 500 Index could be heading towards Right Shoulder of a Bullish Head and Shoulder (Inverted Head and Shoulder). Mainly two things are giving me signals for that: 1. Index moved down from 1.576 level @ 2007-10-10 to 663.29 level @ 2009-03-06 in a 3 corrective wave pattern (ABC). Since that low @ 663.29, price moved in a 5 impulsive wave pattern, and seems to be ended wave 5 @ 956.21 last 2009-06-11. |
| 2. Price broke 38.2 Fib Fan channel of the entire move form 1.576 level @ 2007-10-10 to 663.29 level @ 2009-03-06. I expect a correction down to 38.2 – 61.8 Fib Retracement level of this last swing (which will form Right Shoulder) before price resume rising to 61.8 Fib Fan level. |
 |
 |
Monday, June 8, 2009
CITI, showing bullish signs…
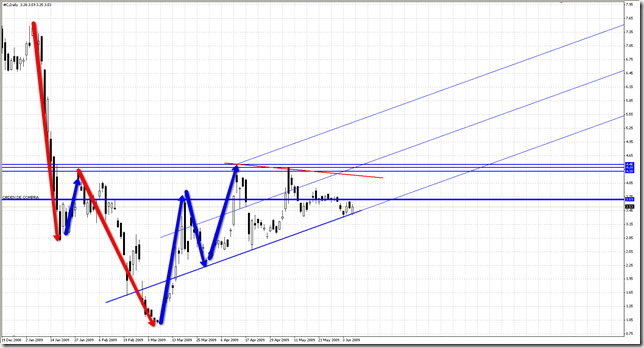
| There are two important signs of bullish bias in this stock. The first one is the possible Head and Shoulder Pattern that is finding important resistance at Neckline. |
 |
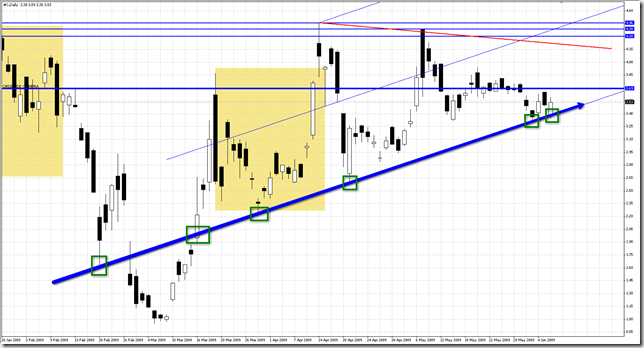
| In that context, a very important support Trend Line have been touched and respected for 6 times. |
 |
Monday, June 1, 2009
NZDUSD… doing VERY well
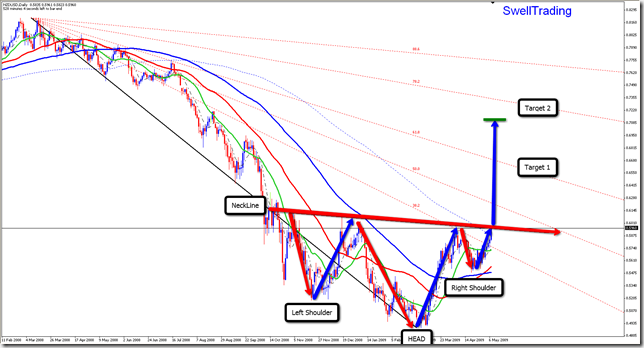
This was the forecast i made at May 7th.: http://swelltrader.blogspot.com/2009/05/nzdusd-h4-bullish-head-and-shoulders.html
Este fue el forecast que hice en Mayo 7: http://swelltrader.blogspot.com/2009/05/nzdusd-h4-bullish-head-and-shoulders.html

Todate, the pair is unfolding a “textbook” Head and Shoulders … doing very well.
A la fecha, el parte esta desarrollando un Head and Shoulders “de libro”… va muy bien.

-
Thursday, May 7, 2009
NZDUSD, H4 Bullish Head and Shoulders
This pair is now at a critical moment for trend reversal.
We`ll wait for break and retest of the neckline to go long. Note that price entered 38.2 fibfan channel. That should lead price to 61.8 level.
Este par esta pasando por un momento crítico para el cambio de tendencia.
Esperare un break and retest del neckline para comprar. Notar que el precio ha entrado en el canal Fibfan 38.2. Eso debe llevar el precio al nivel de 61.8.
-
Friday, April 3, 2009
USDCAD, Gartley Harmonic Pattern in the making
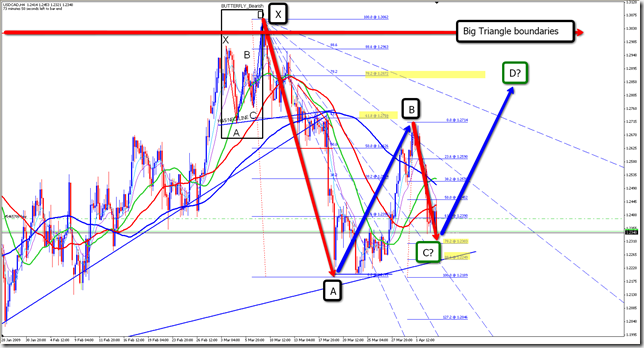 | Within the big ¿bullish? triangle , there is a possible Gartley in the making, now ending BC leg. Expecting to drop down to 1.2303 to conform C point and then begin rising to final D point. |
| - |
Thursday, April 2, 2009
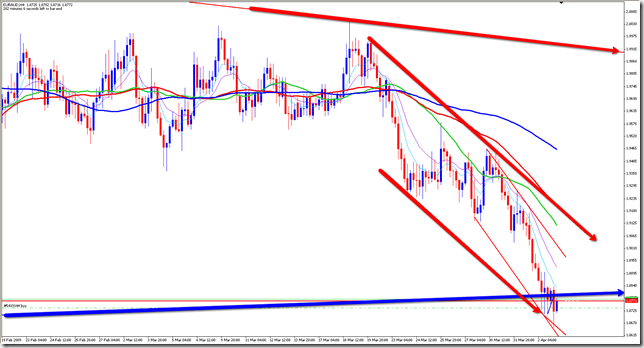
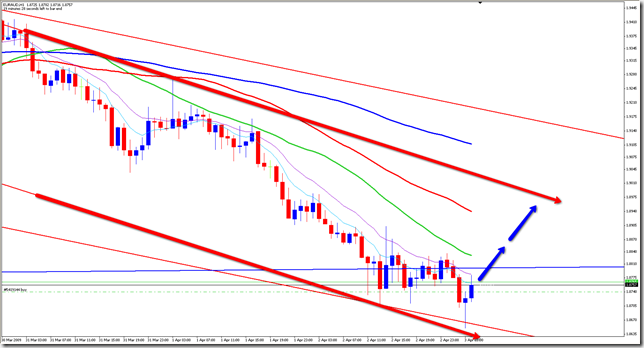
EURAUD, Bullish Triangle
 | The whole idea is to catch the bullish move within the triangle, in order to be in a free trade if the bullish breakout occurs. La idea es coger en el movimiento alcista dentro del triangulo, de forma que cuando se de el breakout alcista, estemos en una “free trade”. |
 | |
 | |
| - |

Wednesday, April 1, 2009
CITI, 5 min Bullish Pennant (Follow Up)
 | What was expected to be a Bullish Pennant, finally became a Bullish Flag (See red square). While i am writing this post, 1 hour after market open, seems to be buyers are taking control of the session since retest is having problems to occur. Lo que se esperaba fuera un banderín alcista, finalmente se convirtió en una bandera alcista (Ver recuadro rojo). En la apertura de hoy, el precio “exploto” como se preveía, con una exactitud “al pip” (30 pips). Mientras escribo este post, una hora después de abierto el mercado, parece ser que los compradores están tomando el control de la sesión, debido a la dificultad que se nota para que el retest ocurra. |
| - |
USDJPY, Bullish pennant
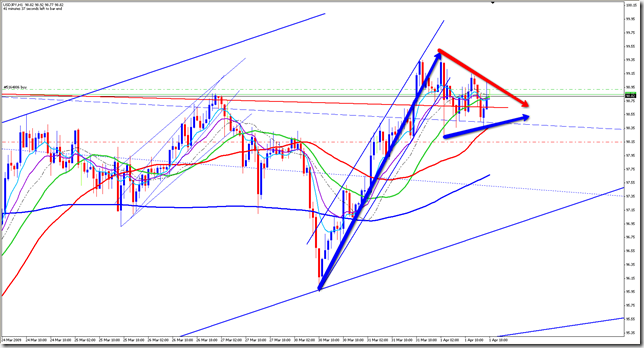 | Very well formed Bullish pennant about to “explode”. Muy bien formado Banderín Alcista a punto de explotar. |
| - |
Subscribe to:
Posts (Atom)
Performance
Here i`ll post my performance on a USD 200 demo account.
After trading for 2 months, i`ll create a new one.


 Posts
Posts


