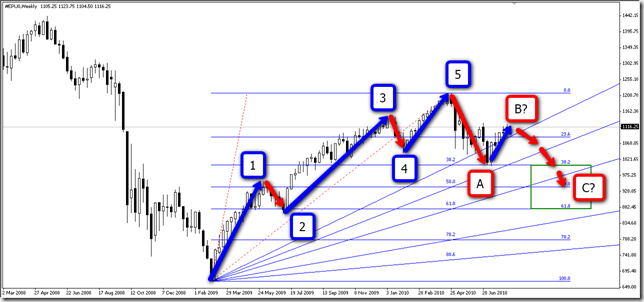
| After the clearly defined 5 waves bullish move, price is unfolding an ABC correction pattern, now at possible wave B completion as seen in Chart 2. Is important to note, as seen in Chart 1, that even though price rejected from 38.2 Fib Retracement level, it entered and broke 38.2 Fib Fan Channel, giving high possibilities of reaching 61.8 level. Finally, but not less important, is the possible Head and Shoulders pattern seen in Chart 3. Note the symmetry shown between the time spent by price to go from Left Shoulder date to Head and from Head to the possible Right Shoulder (71 days). |
| Chart 1. Elliott Wave counting. |
 |
| Chart 2. Wave B of possible ABC correction. |
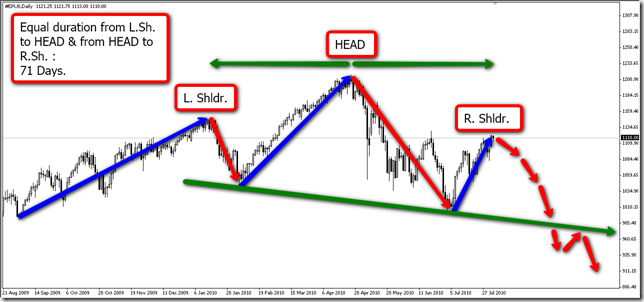 |
| Chart 3. Possible daily Bearish Head and Shoulders in the making. |


Mar de Leva (swell waves) en Cartagena de Indias - Colombia
Showing posts with label HEADandShoulders. Show all posts
Showing posts with label HEADandShoulders. Show all posts
Tuesday, August 3, 2010
I insist… S&P Bearish Head and Shoulders in the making

Tuesday, March 16, 2010
S&P 500: confirmando onda impulsiva alcista
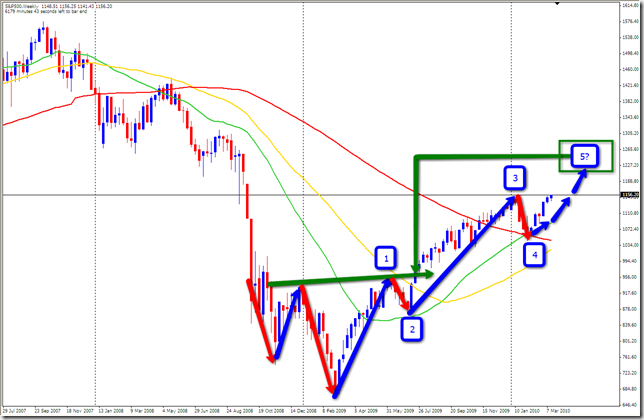
| Hago referencia a mi ultima publicación en enero 24 de 2010 ( http://swelltrader.blogspot.com/2010/01/actual-pullback-del-mercado-de.html), donde mostraba que los principales índices del mercado norteamericano de acciones (S&P 500 y DOW Jones), estaban desarrollando desde Marzo de 2009 un movimiento impulsivo de 5 ondas, así como un patrón Head and Shoulders invertido. Hoy hemos alcanzado nuevos máximos, con lo que quedan confirmandas las ondas 3 y 4 de las cinco ondas mencionadas arriba. Es de esperar que el precio termine de desarrollar el potencial mínimo del Head and Shoulders para llegar a niveles de, por lo menos, 1.228. |
 - |
Sunday, January 24, 2010
Actual pullback del Mercado de norteamericano acciones… no tan bearish como podría parecer
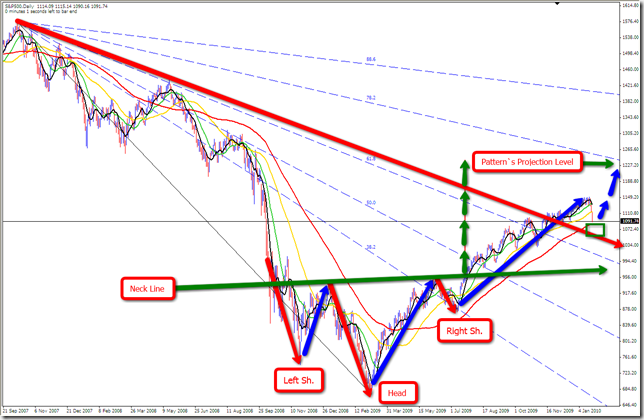 |
| Analizando S&P, varios aspectos técnicos me dan indicios de que la actual caída del mercado norteamericano de acciones no es la que tan recurrentemente se ha venido anunciando en los últimos días. 1. El patrón Head and Shoulders invertido cuya cabeza fue el mínimo de Marzo de 2009, y cuya proyección es el nivel de 1235. Ver: http://swelltrader.blogspot.com/2009/08/s-wave-ii-bearish-finished.html aun esta en proceso de desarrollo. 2. Coherente con lo anterior, el precio se encuentra en un nivel intermedio entre los niveles del 61.8% y 78.2% del “abanico de Fibonacci” trazado entre el máximo de Oct./2007 y el mínimo de Marzo de 2009 (inicio de la recuperación). Nótese la coincidencia entre la proyección del patrón Head and Shoulders y el siguiente nivel FibFan. 3. El rompimiento de la Línea de tendencia trazada entre el máximo de Oct./2007 y el máximo menor en May./2008. La actual caída corresponde a la confirmación de dicho rompimiento.  4. El conteo de Ondas de Elliott muestra una posible coincidencia entre el desarrollo de lo que debería ser la onda 4, la línea de tendencia ya rota que debería actuar ahora como soporte dinámico y los niveles FibFan y Fib Retracement del 38.2%. Sin embargo, existe la posibilidad técnica de que la onda 4, actualmente en desarrollo, llegue a niveles tan bajos como el inicio de la Onda 2, que para efectos prácticos sería 976.30 (61.8 fib ret de toda la onda 3). |
| - |
Friday, January 15, 2010
USDJPY Head and Shoulders… si, pero no
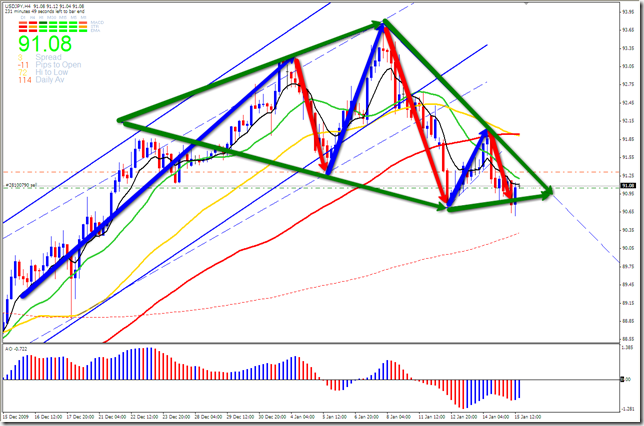 |
| Lo que se veía venir como un Head and Shoulders ( http://swelltrader.blogspot.com/2010/01/anatomia-de-un-head-and-shoulders-en.html ), ha resultado ser una variación del mismo, conocida como “diamond formation”. |
| - |
Tuesday, January 12, 2010
Anatomía de un Head and Shoulders en ciernes en USDJPY
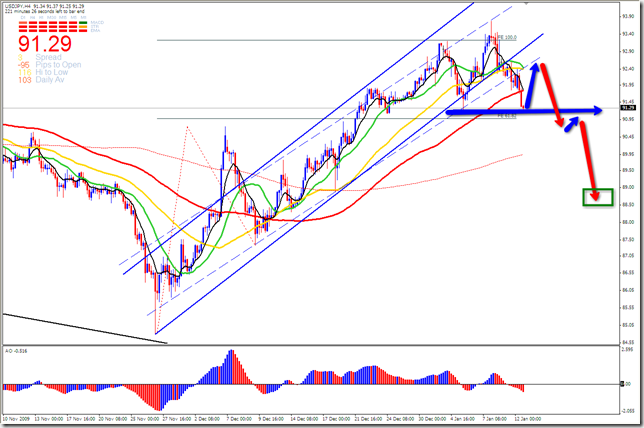 |
| El precio ha roto claramente el canal alcista en la franja de 4 horas. La confirmación de dicho rompimiento debería darse con un pullback hacia la línea de tendencia, tal como lo muestra la grafica. En dado caso, se estaría formando un patrón Head and Shoulders, que llevaría el precio hacia niveles de 88.47. El pullback (que conformaría el hombro derecho) no debería ser mayor que el Retroceso Fibonacci del 78.2% en 93.19. - |
Monday, November 16, 2009
S&P 500, cuenta de Ondas Elliott, Ondas 3 y 4 confirmadas
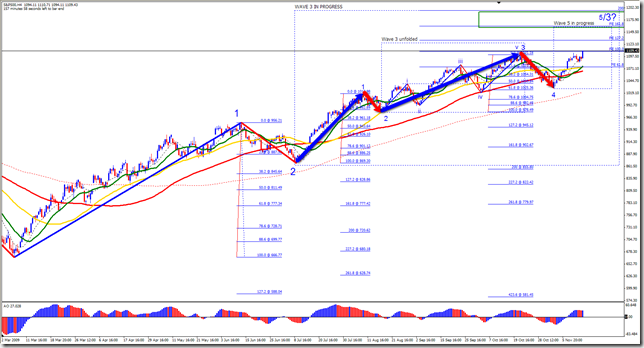 |
| El plano general (arriba) nos muestra que el movimiento desde 666.77 en Marzo de 2009, esta ahora desarrollando una onda 5 de grado menor, correspondiente a la Onda 3 de todo el movimiento desarrollado desde la fecha mencionada. Ver las publicaciones previas AQUI |
 |
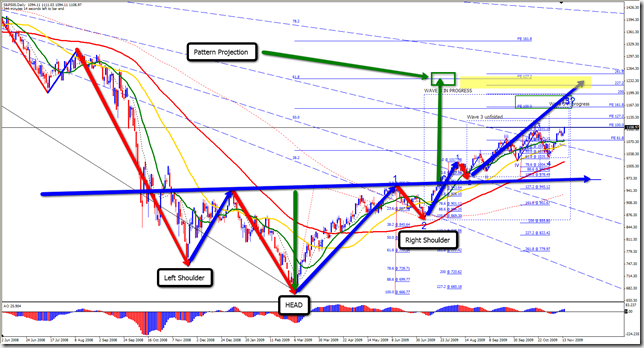
| No podemos olvidar que el precio se encuentra desarrollando un gran Patrón Head and Sholuders, cuya cabeza fue el mínimio de Marzo de 2009, y cuya proyección es el nivel de 1235. Ver: http://swelltrader.blogspot.com/2009/08/s-wave-ii-bearish-finished.html |
 - |
Friday, October 9, 2009

Wednesday, September 30, 2009
EURUSD, end of correction?… if yes, a text book one
| This trend line break and retest and the apparently Head and Shoulders Pattern in the making, would be a text book correction ending. Este rompimiento y retest de tendencia y el aparente Patrón Head and Shoulders que se esta formando, seria un fin de corrección de “libro de texto”. |
 |
| - |
Tuesday, September 22, 2009
USDCAD m5 Bearish Head and Shoulders… “oh what a night!!”
| Just as forecasted ( http://swelltrader.blogspot.com/2009/09/usdcad-m5-possible-bearish-head-and.html ). Definitely a very nice move!! Tal y como se proyecto ( http://swelltrader.blogspot.com/2009/09/usdcad-m5-possible-bearish-head-and.html ). Definitivamente un movimiento bien “bacano”. |
| Forectasted |
 |
| Unfolded |
 |
| - |
Monday, September 21, 2009
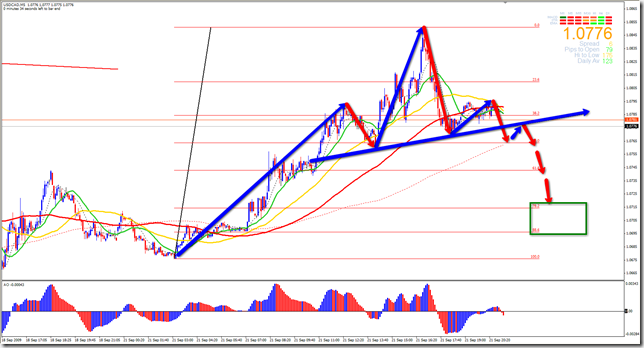
USDCAD, m5. Possible Bearish Head and Shoulders
| If confirmed (break and retest of neckline), this will be a nice 80 pips move. Si se confirma (rompimiento y retest de la línea de cuello), este sera un bonito movimiento de 80 pips. |
 |
| - |
Friday, September 18, 2009


Wednesday, September 9, 2009
GBPUSD H1, Bullish Head and Shoulders
| Have to wait for confirmation of the 123 buy pattern, but i think the most of the possibilities are for a nice bullish move after the unfolding of this pattern. Hay que esperar la confirmación del patrón 123 de compra, pero creo que las mayores posibilidades son de un buen movimiento alcista después del desarrollo de este patrón. |
 |
| - |
Friday, September 4, 2009
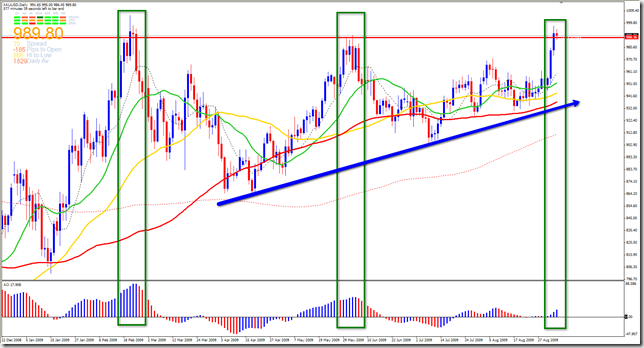
Gold`s long term inverted H&S is about to explode

-
Friday, August 21, 2009
S&P Wave ii (bearish) finished
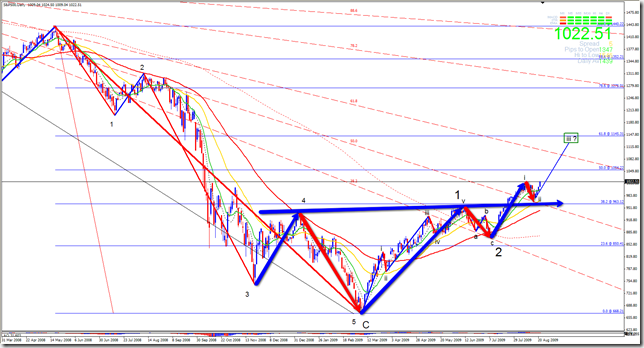
| As we can see, the new high after the AB=CD bearish correction confirms that wave ii is just finished. |
 |
| The wave ii mentioned above act as bigger bullish Head and Shoulder`s neckline retest. Since wave iii can not be the smaller wave of the 5 impulsive waves, we can expect this wave to have, at least, wave i`s measure. That give us a projection to, at least, 1.145.31 level, which corresponds with 61.8 fib retracement level of the entire move from October/2007 high to March/2009 low. I think that from now on, we can expect Huge moves, do to the fact that prices are now unfolding wave iii of a bigger wave 3. |
 |
| - |
Friday, July 31, 2009
Stocks, bottom confirmed?
| With bullish Head and Shoulder`s neckline already broken, i`ll should wait for a decisive retest of this one; but due to GDP number better than expected released this morning, continuation without a pullback for retest could be possible. For detailed explanation of my forecast, see my videocast @ http://www.screencast.com/users/GustavoForex/folders/Swelltrader/media/8f6e9875-9ad1-422c-a6b1-332d0600e0cb |
 |
| - |
USDCAD H4 Bearish Head and Shoulders… follow up
| Nice unfolding of this Head and Shoulders Top. |
Spotted on July 13  |
Nice unfolding. Green rectangle shows Head and Shoulder Pattern.  |
The pattern located within the bearish trend  |
| - |

Thursday, July 23, 2009
Bullish Head and Shoulder almost confirmed, bottoming too…
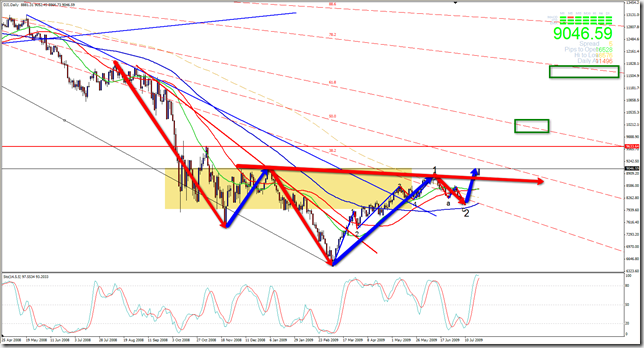
| On July 9th, i posted my forecast for DJI and S&P (view http://swelltrader.blogspot.com/2009/07/stocks-market-major-bottom-in-making.html ). |
| After the bearish move, prices begun to move bullish to actual levels, reaching and breaking bigger Bullish H&S`s Neckline. |
| I expect price pullback to retest broken neckline and continue rising to reach H&S and Fibonacci fibfans+Fibonacci Retracements projections (green rectangles) Important to note that Elliott Wave counting shows that prices are now unfolding wave 3 of the entire move from the very low in March 06/2009. |
 |
 |
| - |
Friday, July 17, 2009

Wednesday, July 15, 2009
USDJPY, very low risk Short Entry (H&S Pattern)
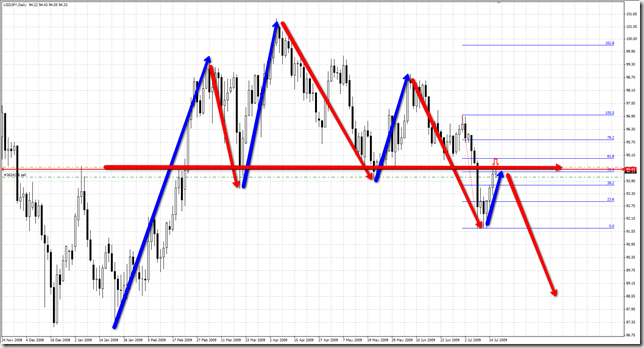 |
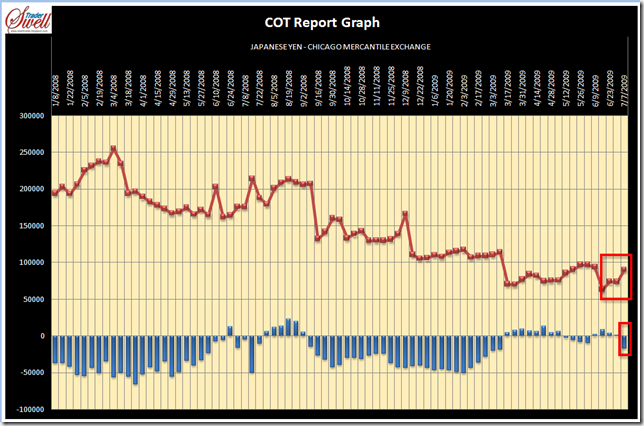
| Additionally to the bearish Head and Shoulders Pattern showed above, COT report (Commitment of Traders) analysis (below) for USDJPY, shows that the Non Commercials has been flipped to a Net Short position, after 16 weeks of indecision, which corresponds with the time expended for the H&S pattern to conform. I`ll maintain this trade until the COT report flips again but to a Net Long position and i will do it in a demo account, since is my first time in this kind of analysis. |
 |
| - |
Subscribe to:
Posts (Atom)
Performance
Here i`ll post my performance on a USD 200 demo account.
After trading for 2 months, i`ll create a new one.


 Posts
Posts


