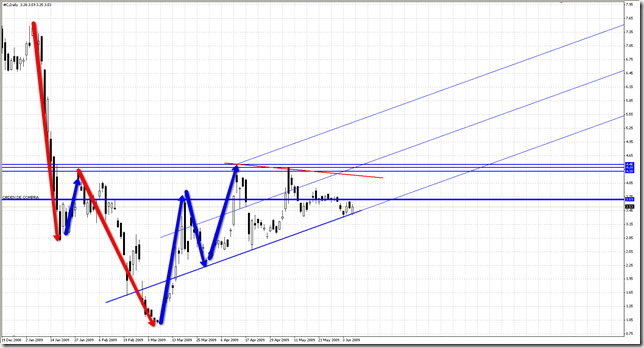
| There are two important signs of bullish bias in this stock. The first one is the possible Head and Shoulder Pattern that is finding important resistance at Neckline. |
 |
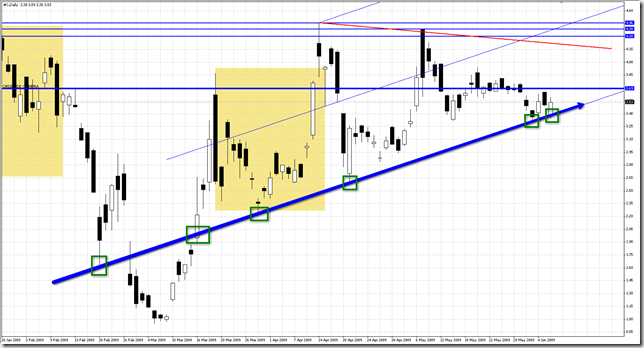
| In that context, a very important support Trend Line have been touched and respected for 6 times. |
 |


Mar de Leva (swell waves) en Cartagena de Indias - Colombia
Showing posts with label CITI. Show all posts
Showing posts with label CITI. Show all posts
Monday, June 8, 2009
CITI, showing bullish signs…

Monday, April 20, 2009
CITI, Follow up & Elliott Wave analysis
 |
| Elliott Wave analysis of the correction from 4.46, shows that this one could be reaching its ending level in a fib zone remarked in yellow. That means that we can be “ad portas” of wave 5 beginning |
| El análisis Elliott Wave de la corrección desde 4.46, muestra que esta podría estar llegando a su nivel de finalización en una zona fib remarcada en amarillo. Lo anterior significa que estaríamos “ad portas” del inicio de la onda cinco (5) - |
Tuesday, April 14, 2009
Tell me that Fibs don´t work
 |
| As Sunil Mangwani, one of my teachers use to say “… tell me that fibs don´t work…” See how price bounced exactly form Fib fan channel and Fib extension zone. |
| Como diría Sunil Mangwani, uno de mis profesores: “…díganme que los Fibs no funcionan…” Miren como el precio reboto exactamente en la zona fib entre Fans y extensión. - |
CITI, Finally new highs…
 |
| Finally we have new highs in this stock. Price seems to be unfolding Wave 3 of a bigger Wave 3. If price breaks 61.8 Fib Fan Channel, we should expect price to go up to 6.00 level. Finalmente tenemos nuevos máximos en esta acción. Aparentemente el precio esta desenvolviendo una onda 3 de una onda 3 mas grande. Si el precio rompe el canal FibFan del 61.8, debemos esperar que suba hasta niveles de 6.00. |
| - |
Wednesday, April 1, 2009
CITI, 5 min Bullish Pennant (Follow Up)
 | What was expected to be a Bullish Pennant, finally became a Bullish Flag (See red square). While i am writing this post, 1 hour after market open, seems to be buyers are taking control of the session since retest is having problems to occur. Lo que se esperaba fuera un banderín alcista, finalmente se convirtió en una bandera alcista (Ver recuadro rojo). En la apertura de hoy, el precio “exploto” como se preveía, con una exactitud “al pip” (30 pips). Mientras escribo este post, una hora después de abierto el mercado, parece ser que los compradores están tomando el control de la sesión, debido a la dificultad que se nota para que el retest ocurra. |
| - |
Subscribe to:
Posts (Atom)
Performance
Here i`ll post my performance on a USD 200 demo account.
After trading for 2 months, i`ll create a new one.


 Posts
Posts

