 |
| Seems to be that the Bullish Flat Triangle have failed. |
 |


Mar de Leva (swell waves) en Cartagena de Indias - Colombia
Wednesday, April 15, 2009
USDCAD, possible Bearish Head & Shoulders

Tuesday, April 14, 2009
Tell me that Fibs don´t work
 |
| As Sunil Mangwani, one of my teachers use to say “… tell me that fibs don´t work…” See how price bounced exactly form Fib fan channel and Fib extension zone. |
| Como diría Sunil Mangwani, uno de mis profesores: “…díganme que los Fibs no funcionan…” Miren como el precio reboto exactamente en la zona fib entre Fans y extensión. - |
CITI, Finally new highs…
 |
| Finally we have new highs in this stock. Price seems to be unfolding Wave 3 of a bigger Wave 3. If price breaks 61.8 Fib Fan Channel, we should expect price to go up to 6.00 level. Finalmente tenemos nuevos máximos en esta acción. Aparentemente el precio esta desenvolviendo una onda 3 de una onda 3 mas grande. Si el precio rompe el canal FibFan del 61.8, debemos esperar que suba hasta niveles de 6.00. |
| - |
Monday, April 13, 2009
EURGBP, Follow up
| Favouring the Bearish bias, we cans see bearish divergences in both 1 and 4 hours time frames. Favoreciendo la tendencia bajista, podemos ver divergencias bearish tanto en la franja de 1 como de 4 horas. | |
 | Bearish Regular Divergence |
 | Bearish Hidden Divergence |
-
Friday, April 10, 2009
EURAUD, follow up & Elliott Wave analysis
 | This was the last week outlook: http://swelltrader.blogspot.com/search/label/EURAUD Esta fue la visión de la semana pasada. |
 | That triangle seems to be a flag. El triangulo, aparentemente es una bandera. |
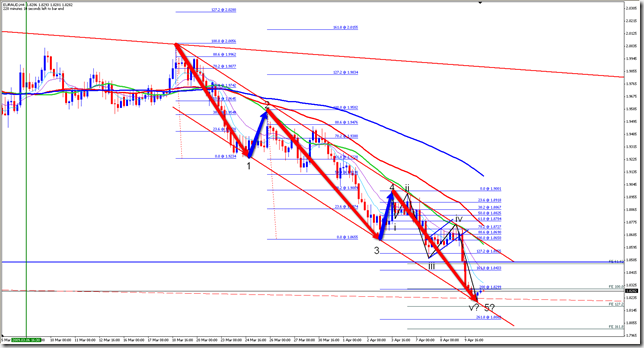 | This is the Elliott Wave analysis for the last H4 wave down. Have to wait for a clear turn around to confirm EW 5 wave move finish. Este es el análisis Elliott Wave para la última onda bajista en la franja de 4 horas. Hay que esperar un cambio claro de tendencia para confirmar el final del movimiento de 5 ondas EW. |
Wednesday, April 8, 2009
EURGBP, big bearish Butterfly & Gartley
 | As can be seen, there is a BIG Bearish Butterfly Harmonic Pattern in the monthly time frame, which give us the big picture of the price movement of the pair: Bearish. Than should lead prices down to, at least, 0.7741, which corresponds with 61.8 fib ret level of XA leg. Como se puede ver en la grafica, hay un gran patrón Armónico Butterfly bajista en la franja mensual, lo que nos da la visión general del movimiento del precio: bajista. Eso debe llevar el precio hasta, por lo menos, 0.774, que corresponde al 61.8 fib ret. del movimiento XA. |
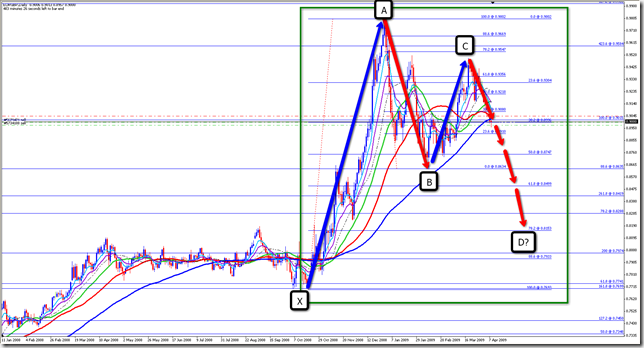 | Within that BIG Butterfly, price is unfolding what can be a bullish Gartley, now unfolding possible CD leg and which can be profited until its D point. Dentro de ese gran patrón Butterfly, el precio esta desenvolviendo un posible Gartley alcista, ahora desenvolviendo lo que sería el segmento CD y que puedeser transado hasta su punto D. |
Tuesday, April 7, 2009
USDJPY, Bearish Gartley
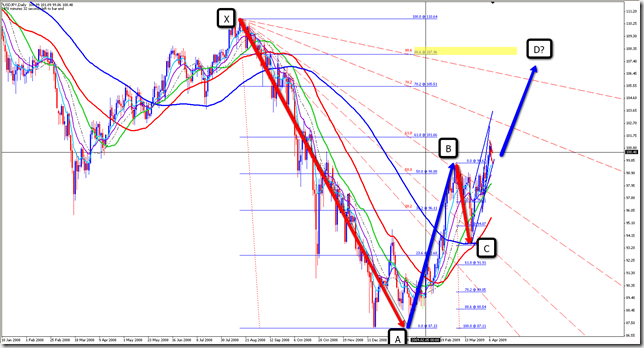 | As can be seen, price is moving within 61.8 and 78.2 fibfan channels, so is expected price to reach, at least, 78.2 channel. Como se puede ver en la gráfica, el precio se esta moviendo entre los canales fibfan 61.8 y 78.2, lo que implica que el precio debe llegar, por lo menos, al nivel del 78.2 fibfan channel. Además, el precio podría estar desarrollando un Patrón Armónico Gartley, lo que significa que este podría subir hasta el nivel del 88.6 fib ret. del segmento XA. |
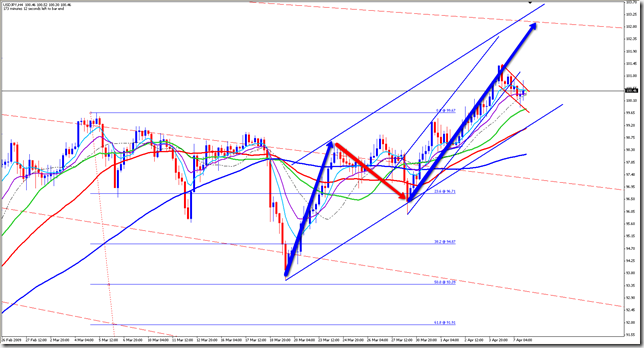 | In lower time frame, we can see price moving within a bullsih channel, no in a pullback. En franjas de tiempo menores, podemos ver que el precio se mueve dentro de un canal alcista y actualmente esta en un pullback. |
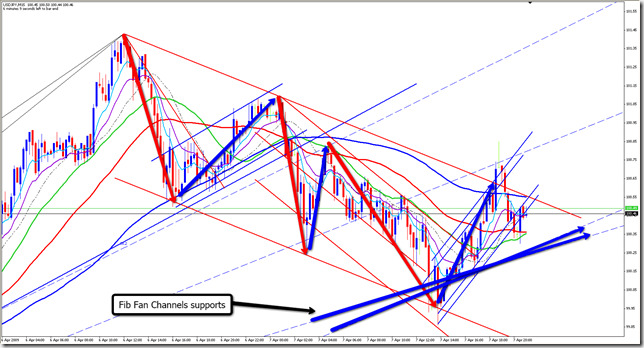 | In 15 min TF, we can see that price is moving between Fibfan channels supports and top side of the flag correction pattern. Have to wait for a breakout of the flag, or an entry to the fibfan channels which will make price to drop looking for the bottom side of the flag. En la franja de 15 minutos, podemos ver que el precio se esta moviendo entre los soportes que suministran los canales fibfan y la línea superior de la bandera correctiva bajista. Hay que esperar un breakout de dicha bandera O la entrada a los canales fibfan, lo que implicaría que el precio caería hasta la parte baja de la bandera bajista. |
-
Subscribe to:
Posts (Atom)
Performance
Here i`ll post my performance on a USD 200 demo account.
After trading for 2 months, i`ll create a new one.


 Posts
Posts

