 |
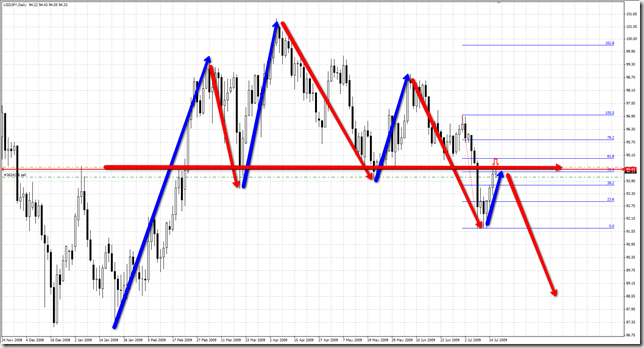
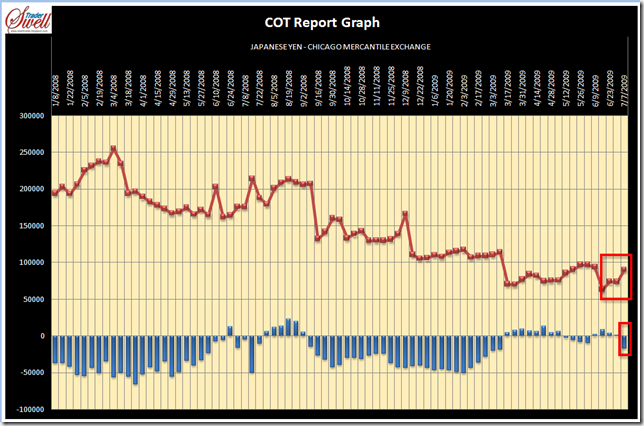
| Additionally to the bearish Head and Shoulders Pattern showed above, COT report (Commitment of Traders) analysis (below) for USDJPY, shows that the Non Commercials has been flipped to a Net Short position, after 16 weeks of indecision, which corresponds with the time expended for the H&S pattern to conform. I`ll maintain this trade until the COT report flips again but to a Net Long position and i will do it in a demo account, since is my first time in this kind of analysis. |
 |
| - |


Mar de Leva (swell waves) en Cartagena de Indias - Colombia
Wednesday, July 15, 2009
USDJPY, very low risk Short Entry (H&S Pattern)

Monday, July 13, 2009

Thursday, July 9, 2009
Stocks Market, major bottom in the making…



Wednesday, July 8, 2009
GBPJPY… i always wanted to say this: “… ¡BANG! ”
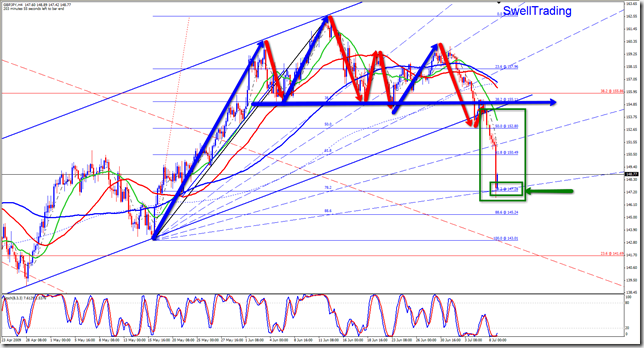 |
| See previous post on this topic: http://swelltrader.blogspot.com/2009/07/gbpjpy-poised-to-big-short-bearish-move.html |
| - |
Tuesday, July 7, 2009
Definitely very good bearish opportunity in GBPJPY
| Important to note that from 5 min to H4 timeframe, all MA`s are positioned in bearish “trend mode” |
 |
| - |
GBPJPY poised for a bearish move
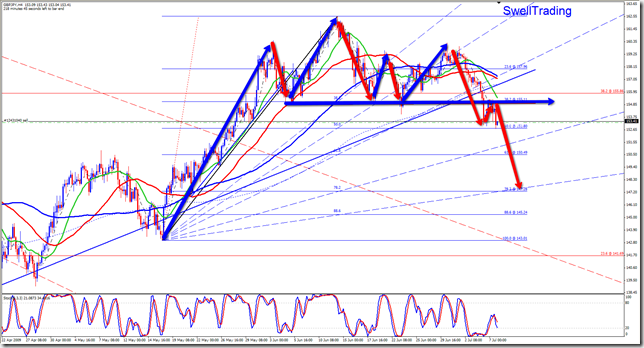
| Based on my previous post on june 22th ( http://swelltrader.blogspot.com/2009/06/gbpjpy-h4-head-and-shoulders-in-making.html ), and after the possible bearish H&S`s neckline has been broken and retested, i think this pair will unfold a big bearish move of about 700 pips. |
 |
| - |
Friday, July 3, 2009
S&P bearish Head and Shoulders, coherent with Elliott Wave counting
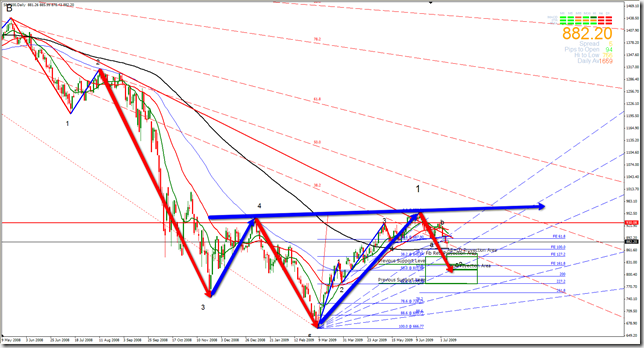
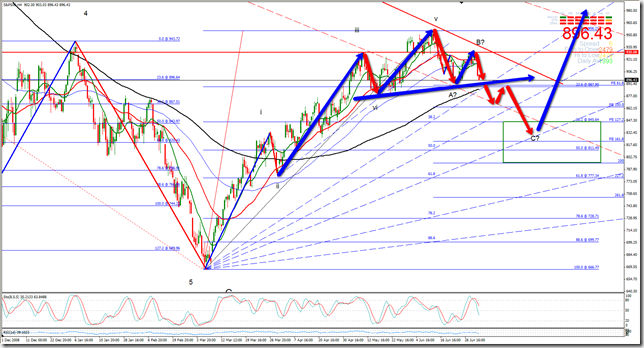
| Continuing with my forecast done in June 15th ( see http://swelltrader.blogspot.com/2009/06/s-heading-for-bullish-head-and.html ), i see actual S&P index moves being coherent with the fact that the index is unfolding a bearish correction after 5 impulsive waves (i, ii, iii, iv & v), to conform wave 2 (ABC) of a bigger bullish move (5 bullish impulsive waves). Is very important to note that this bearish correction is being made thru the conformation of a possible bearish H&S in H4 time frame I`ll wait for H&S`s neckline break and retest for confirmation. |
 |
| - |
Subscribe to:
Posts (Atom)
Performance
Here i`ll post my performance on a USD 200 demo account.
After trading for 2 months, i`ll create a new one.


 Posts
Posts


