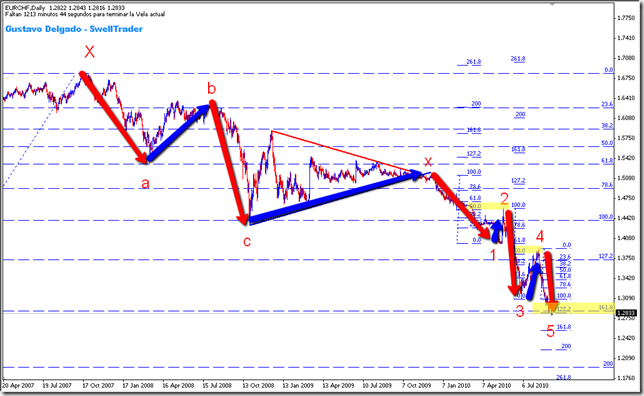
| Here the very Big picture of this pair. Red lines are the same length. Interesting to see the measured move of price action of the bearish swings. What we se here is a Complex Corrective Pattern. |
 |
| Below, detailed view of the last part of the pattern. |
 |


Mar de Leva (swell waves) en Cartagena de Indias - Colombia
Tuesday, September 7, 2010
EURCHF Follow Up

USDCOP: Elliott Wave Counting


Monday, September 6, 2010
EURCHF: Possible Multi-Month bottom
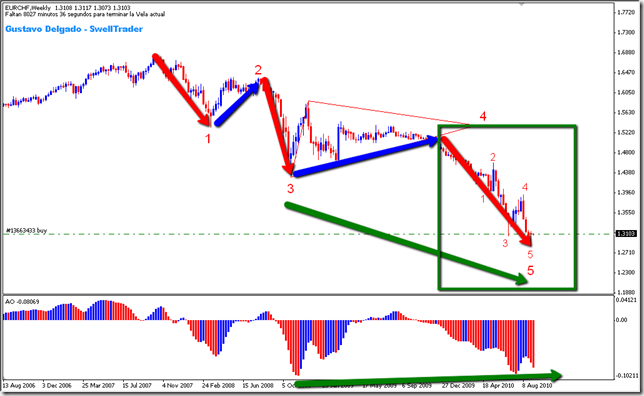
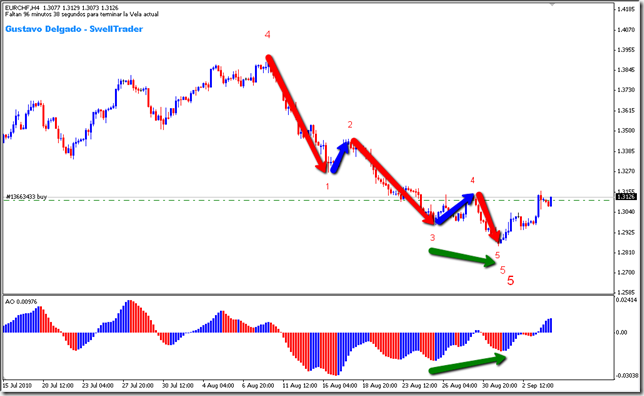
| My Elliott Wave counting gives me 3 levels of 5th wave yet completed in W1, D1, and H4 respectively. Is important to note that Bullish divergence is present between W3 and W5 extremes in each of the mentioned Time Frames. This could be a multi-month bottom which could lead prices up to 1.4366 level in about 10-20 months. |
 |
 |
 |
| - |
Wednesday, September 1, 2010
EURUSD Bearish scenario
| Today`s Bullish movement put H&S scenario in troubles. If price stays below corrective WA`s w4 level (1.2920) H&S scenario is still valid. |
 |
| A more detailed view of actual price action is showed below. Fibonacci Price and Time Retracements, as well as Fibonacci Expansion, gives us as possible WB level @ 1.2870 – 1.2938 area, if not is yet finished. |
 |
Friday, August 6, 2010
USDCOP: a punto de confirmar nuevos mínimos
| Un rompimiento decisivo del nivel de 1.819, implicaría la confirmación del banderín bajista (líneas roja y azul livianas). La confirmación del rompimiento del nivel mencionado (1.819), nos llevaría a una zona de congestión, cuyo nivel de soporte esta en 1.700.oo. Dado que evidentemente estamos en una tendencia bajista, yo mantendría las posiciones cortas siempre que el precio se mueva dentro del canal bajista. |
 |
Tuesday, August 3, 2010
I insist… S&P Bearish Head and Shoulders in the making
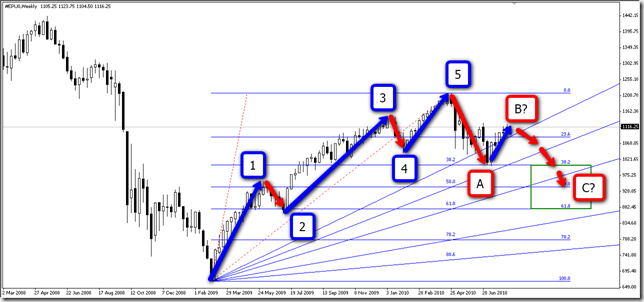
| After the clearly defined 5 waves bullish move, price is unfolding an ABC correction pattern, now at possible wave B completion as seen in Chart 2. Is important to note, as seen in Chart 1, that even though price rejected from 38.2 Fib Retracement level, it entered and broke 38.2 Fib Fan Channel, giving high possibilities of reaching 61.8 level. Finally, but not less important, is the possible Head and Shoulders pattern seen in Chart 3. Note the symmetry shown between the time spent by price to go from Left Shoulder date to Head and from Head to the possible Right Shoulder (71 days). |
| Chart 1. Elliott Wave counting. |
 |
| Chart 2. Wave B of possible ABC correction. |
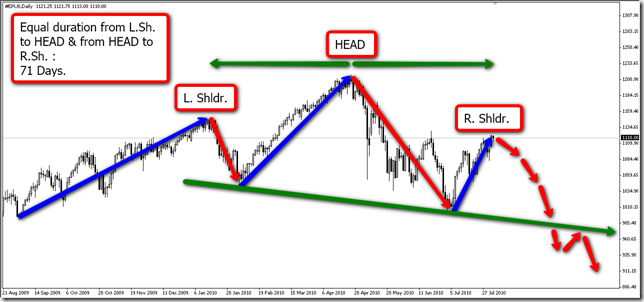 |
| Chart 3. Possible daily Bearish Head and Shoulders in the making. |
Thursday, July 1, 2010
EURUSD Bullish H&S scenario is not matching the "puzzle"
Via twitter i posted a chart analysis on a possible EURUSD Bullish Head and Shoulders Pattern.

This scenario is not matching the "puzzle" composed by S&P, Gold and Oil.
Both, S&P and Oil are developing possibles Bearish Head and Shoulders scenarios, while Gold is making a Rising Wedge, signifinig an inminent drop down.
I have to cite Bob Pretcher`s study in which he analize that Gold tends to rise in expanding periods, not in contracting ones. S&P and Oil bearish scenarios will be coherent with a contracting period , so with a drop in Gold price (Rising Wedge Scenario).
In my humbbe opinion, if the hipothesis/scenarios stated for S&P, Gold and Oil comes true, an EURUSD bullish scenario is not easy to realize.
S&P
Oil

Gold 
Subscribe to:
Posts (Atom)
Performance
Here i`ll post my performance on a USD 200 demo account.
After trading for 2 months, i`ll create a new one.


 Posts
Posts


